8 Scalping Trading Strategies with Full Parameters | Upscale


Scalping is a trading style focused on capturing small price movements through high-frequency execution — typically holding positions from seconds to 30 minutes. The approach relies on tight spreads, fast execution, and disciplined risk management rather than directional conviction about larger market moves. This guide covers eight systematic scalping strategies with specific parameters for entries, exits, stop-losses, and market conditions: Moving Average Crossover, Bollinger Band Squeeze, RSI Divergence, VWAP Mean Reversion, Support/Resistance Bounce, Stochastic Momentum, News Spike Fade, and Opening Range Breakout. One honest caveat before diving in: high-frequency trading historically correlates with underperformance. Barber and Odean (2000), analyzing 66,465 household brokerage accounts, found that the most active traders underperformed the market by 6.5 percentage points annually due to commissions, spreads, and execution errors — and a PipFarm survey of 2,777 prop traders (2025) found that 45.1% of successful prop traders make only 1–2 trades per day. Scalping works only when strategy selection matches market conditions and execution remains ruthlessly disciplined.
⚠️ About the performance numbers: The win rates, profit factors, and trade durations listed for each strategy are theoretical ranges based on common parameter configurations, not guaranteed outcomes or backtested results from specific data sets. Use them as rough benchmarks for setup quality comparison, not as promises. Any strategy's real-world performance depends on execution discipline, market conditions, spreads, commissions, and individual trader psychology.
Strategy Selection Framework: Matching Methods to Market Conditions
No single strategy works universally. Markets shift between trending, ranging, volatile, and calm. Successful scalpers assess market character using quantifiable metrics before entering positions.
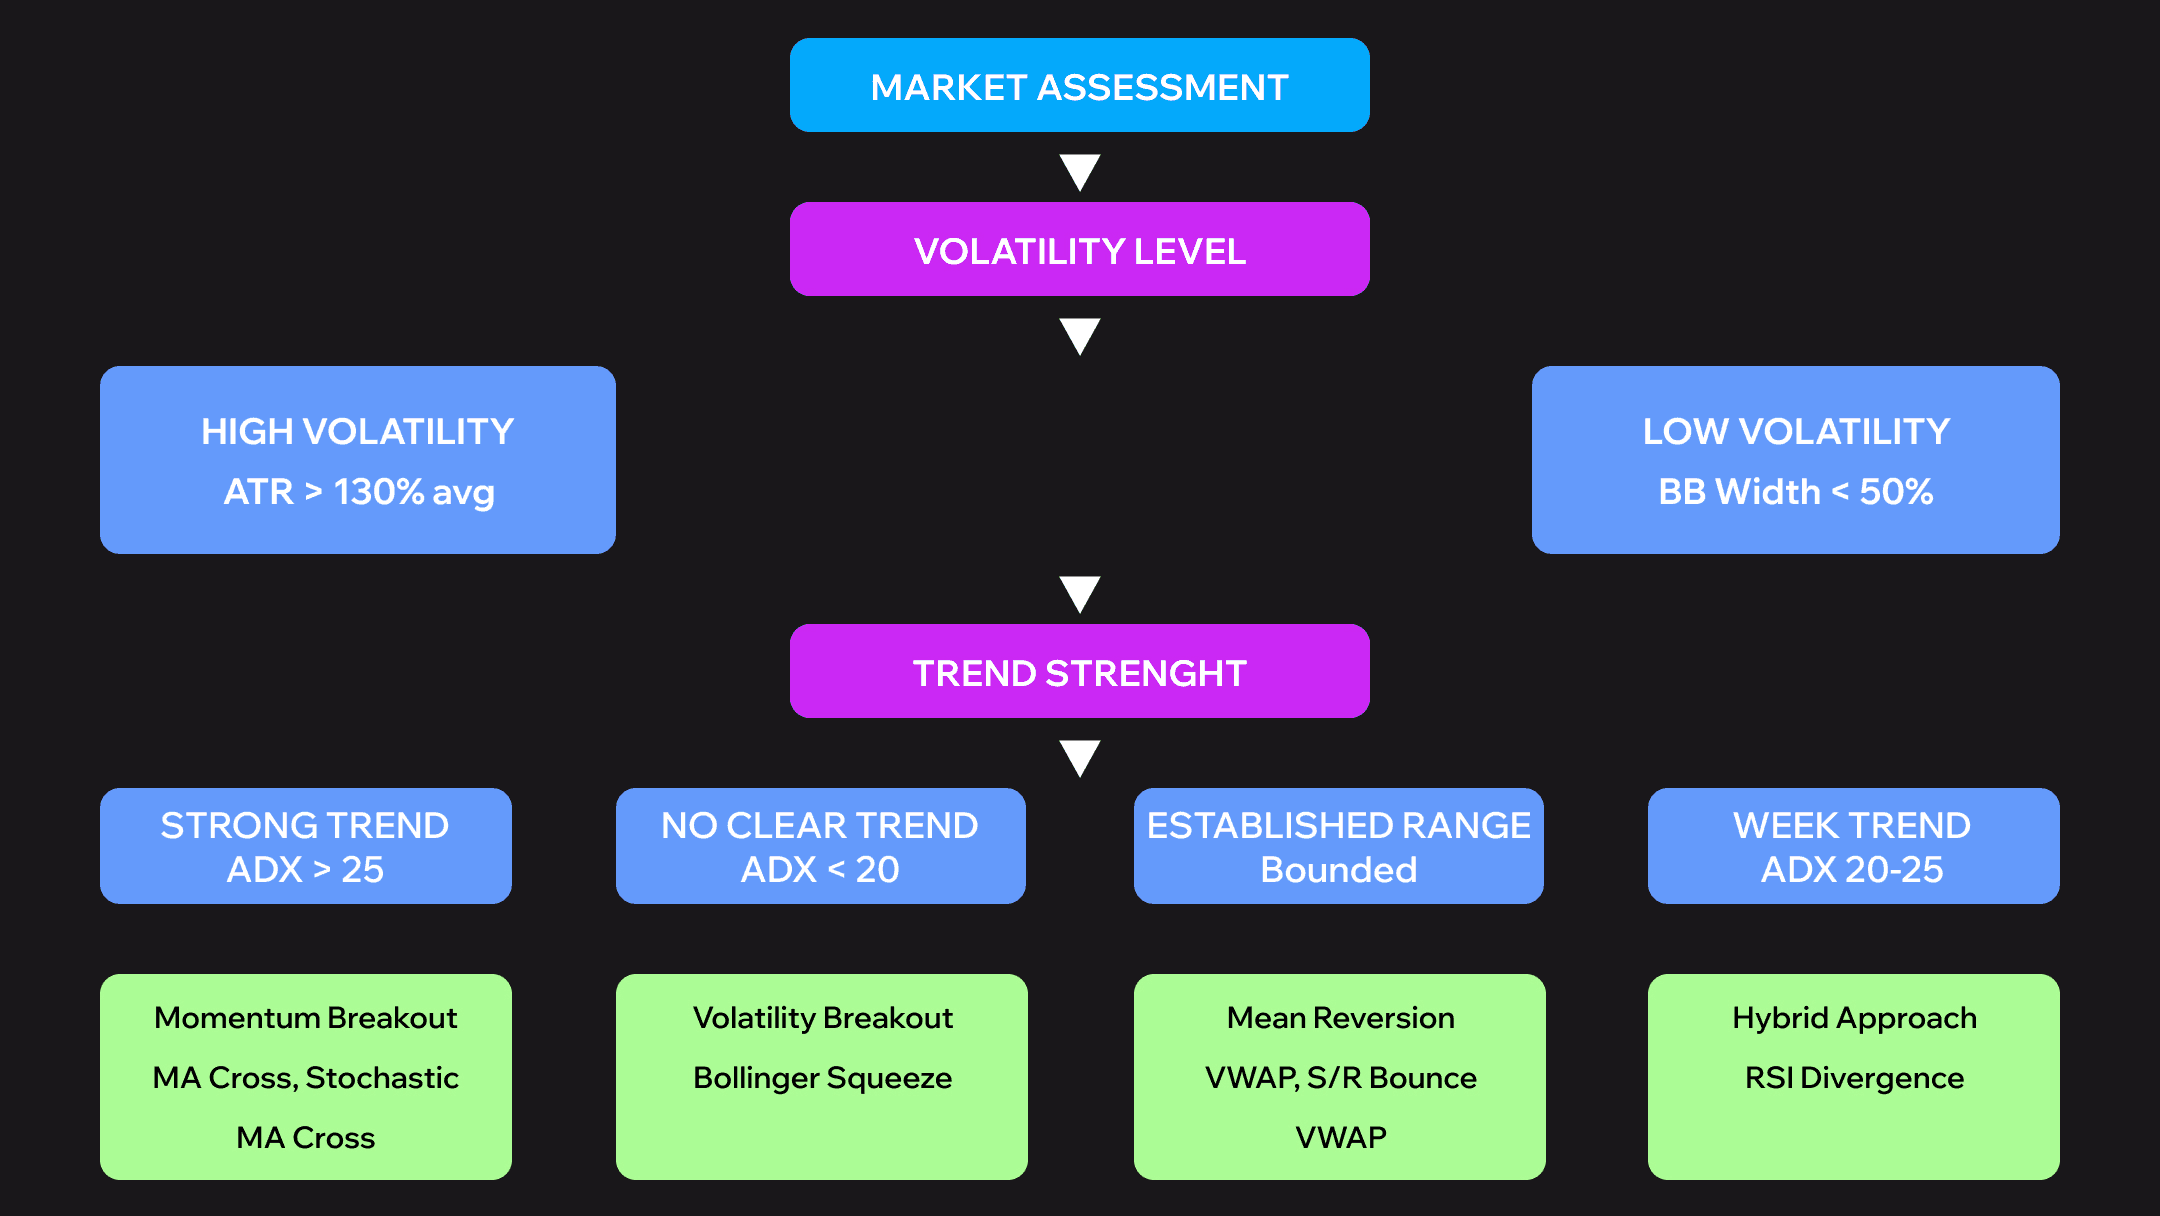
Framework Structure:
- High Volatility + Strong Trend → Momentum breakout strategies
- High Volatility + No Clear Trend → Volatility breakout strategies
- Low Volatility + Established Range → Mean reversion strategies
- Moderate Volatility + Weak Trend → Hybrid approaches
Quantifiable Thresholds:
Strong Trend = ADX above 25. High Volatility = Current ATR exceeds 130% of 20-period average. Range-Bound = Bollinger Band width below 50% of 3-month average.
Forcing momentum strategies onto ranging markets destroys accounts. Trying mean reversion during strong trends creates losses. Match your method to conditions. Start each session with a 5-minute market assessment: check ADX for trend strength, measure ATR for volatility, observe Bollinger Band width. Then select your strategy arsenal for the day.
The Scalping Strategies: Complete Implementation Guide
Eight strategies follow, each with exact specifications — timeframes, indicator settings, entry rules, exit criteria, optimal instruments, and theoretical performance ranges.
Strategy #1 — Moving Average Crossover
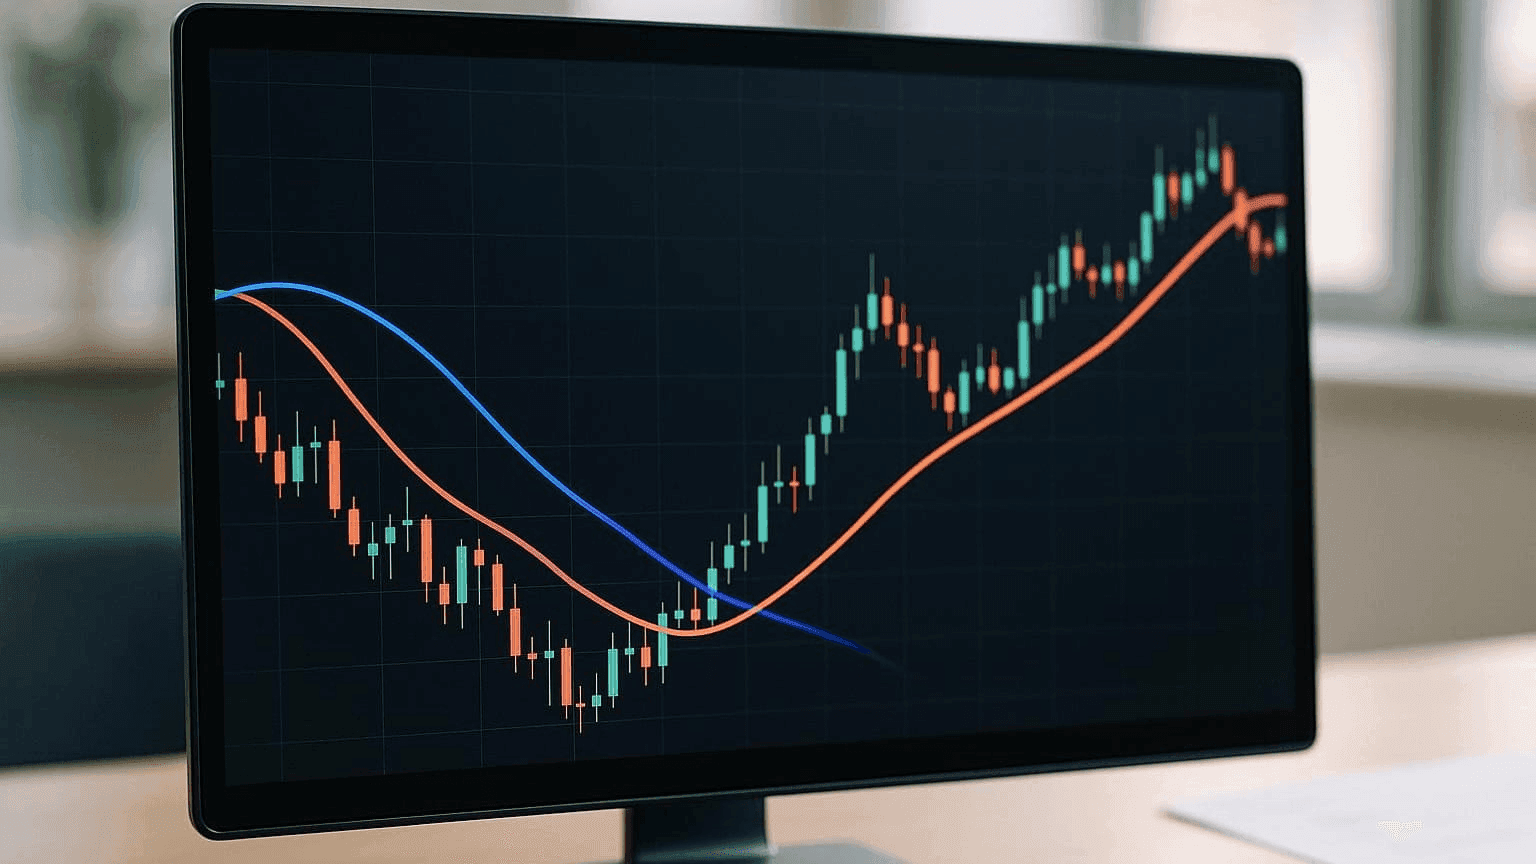
Timeframes: 5-minute analysis, 1-minute execution
Indicators: 8 EMA, 21 EMA, Volume (20-period average), RSI(7)
Entry (LONG): 8 EMA crosses above 21 EMA on 5-min. Both EMAs slope upward. RSI(7) above 50. Volume exceeds 120% average. Price pulls back to 8 EMA on 1-min. Enter on bounce with a bullish candle.
Exit: Target 1.5x ATR(14). Exit if 8 EMA crosses back below 21 EMA. Time-based exit after 20 minutes.
Stop Loss: 0.5x ATR(14), typically 5–8 pips EUR/USD
Risk-Reward: 1:1.5 minimum, targeting 1:2
Optimal Instruments: EUR/USD, GBP/USD, USD/JPY (London/NY overlap). BTC/USDT, ETH/USDT. SPY, QQQ, high-volume tech stocks.
Theoretical Performance Range: 58–63% win rate. 1.7–2.1 profit factor. 8–15 minutes average duration. 8–15 trades per session.
Best Conditions: Clear trending markets with momentum during major session overlaps.
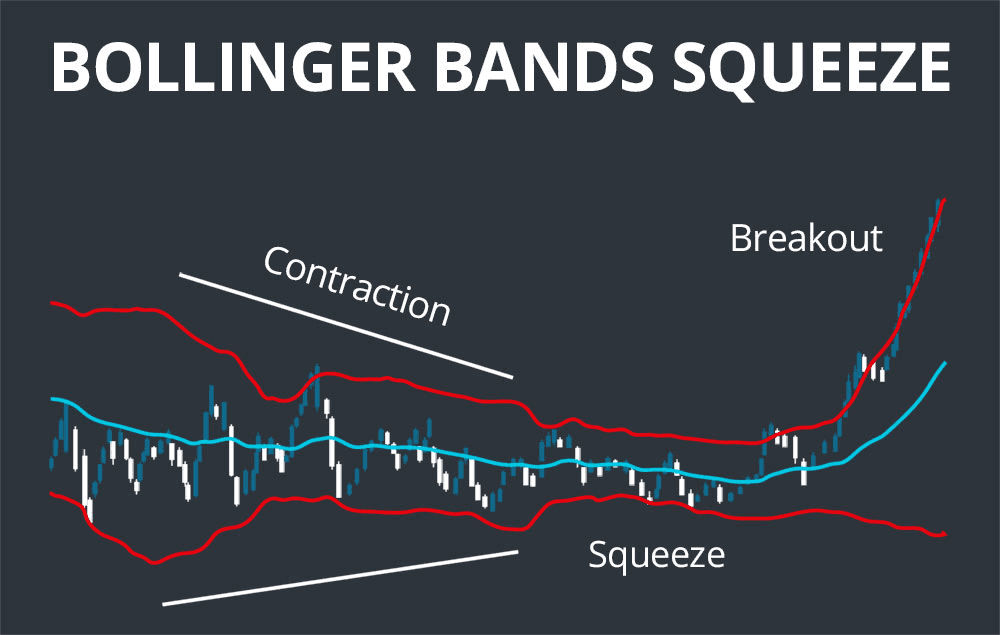
Strategy #2 — Bollinger Band Squeeze
Timeframes: 3-minute primary
Indicators: Bollinger Bands (20,2), BB Width indicator, MACD (12,26,9), Volume (20-period average)
Entry (LONG): BB Width reaches 3-month low. Bands begin expanding. Price closes outside upper BB. MACD histogram turns positive and increasing. Breakout candle volume exceeds 150% average. Enter the next candle at market or limit at previous high.
Exit: Target opposite BB (full band width move). Alternative 2x ATR if the band is too wide. Move stop to breakeven after 1x ATR profit. Time limit 25 minutes.
Stop Loss: Inside squeeze range, typically 0.7x ATR
Risk-Reward: 1:2 to 1:3 (band width dependent)
Optimal Instruments: Major forex pairs during pre-news periods. ETH/USDT, BNB/USDT during consolidation. AAPL, MSFT, TSLA intraday consolidations.
Theoretical Performance Range: 55–60% win rate. 2.0–2.5 profit factor. 12–20 minutes duration. 3–6 quality setups per session.
Best Conditions: Low volatility consolidation periods before expansion.
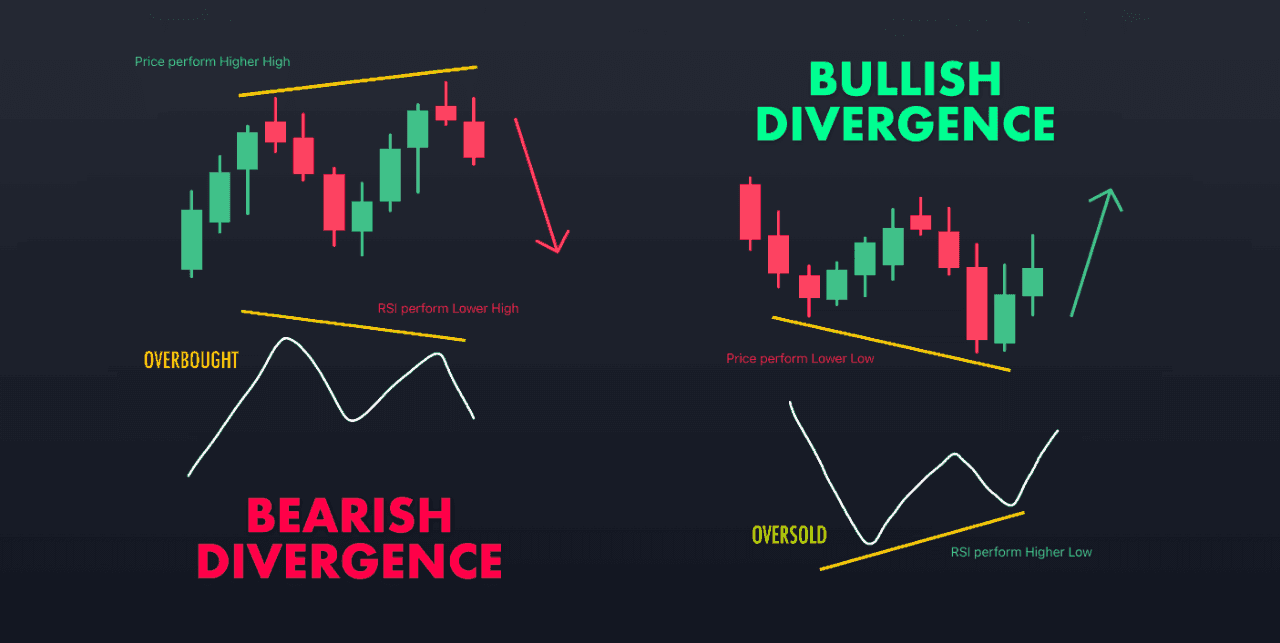
Strategy #3 — RSI Divergence
Timeframes: 5-minute for divergence identification, 1-minute for entry timing
Indicators: RSI(7), Price action (swing highs/lows), 50 EMA, Stochastic(5,3,3)
Entry (LONG — Bullish Divergence): Price below 50 EMA making lower lows. RSI simultaneously making higher lows (divergence). Price reaches support or RSI below 30. Wait for RSI to cross above 30. Stochastic crosses up from oversold on 1-min. Enter with bullish candle confirmation.
Exit: Primary target 50 EMA. Alternative 1.5x ATR if EMA distant. Close 50% at 1x ATR, hold 50% to target. Exit if divergence invalidates.
Stop Loss: Beyond swing extreme (support level)
Risk-Reward: 1:2 minimum, often 1:3+
Optimal Instruments: GBP/JPY, EUR/JPY. Altcoins during corrections. Individual stocks during intraday pullbacks.
Theoretical Performance Range: 65–70% win rate. 2.3–2.8 profit factor. 15–30 minutes duration. 2–4 high-quality setups per session.
Best Conditions: Corrective phases within larger trends, overextended markets.
Strategy #4 — VWAP Mean Reversion
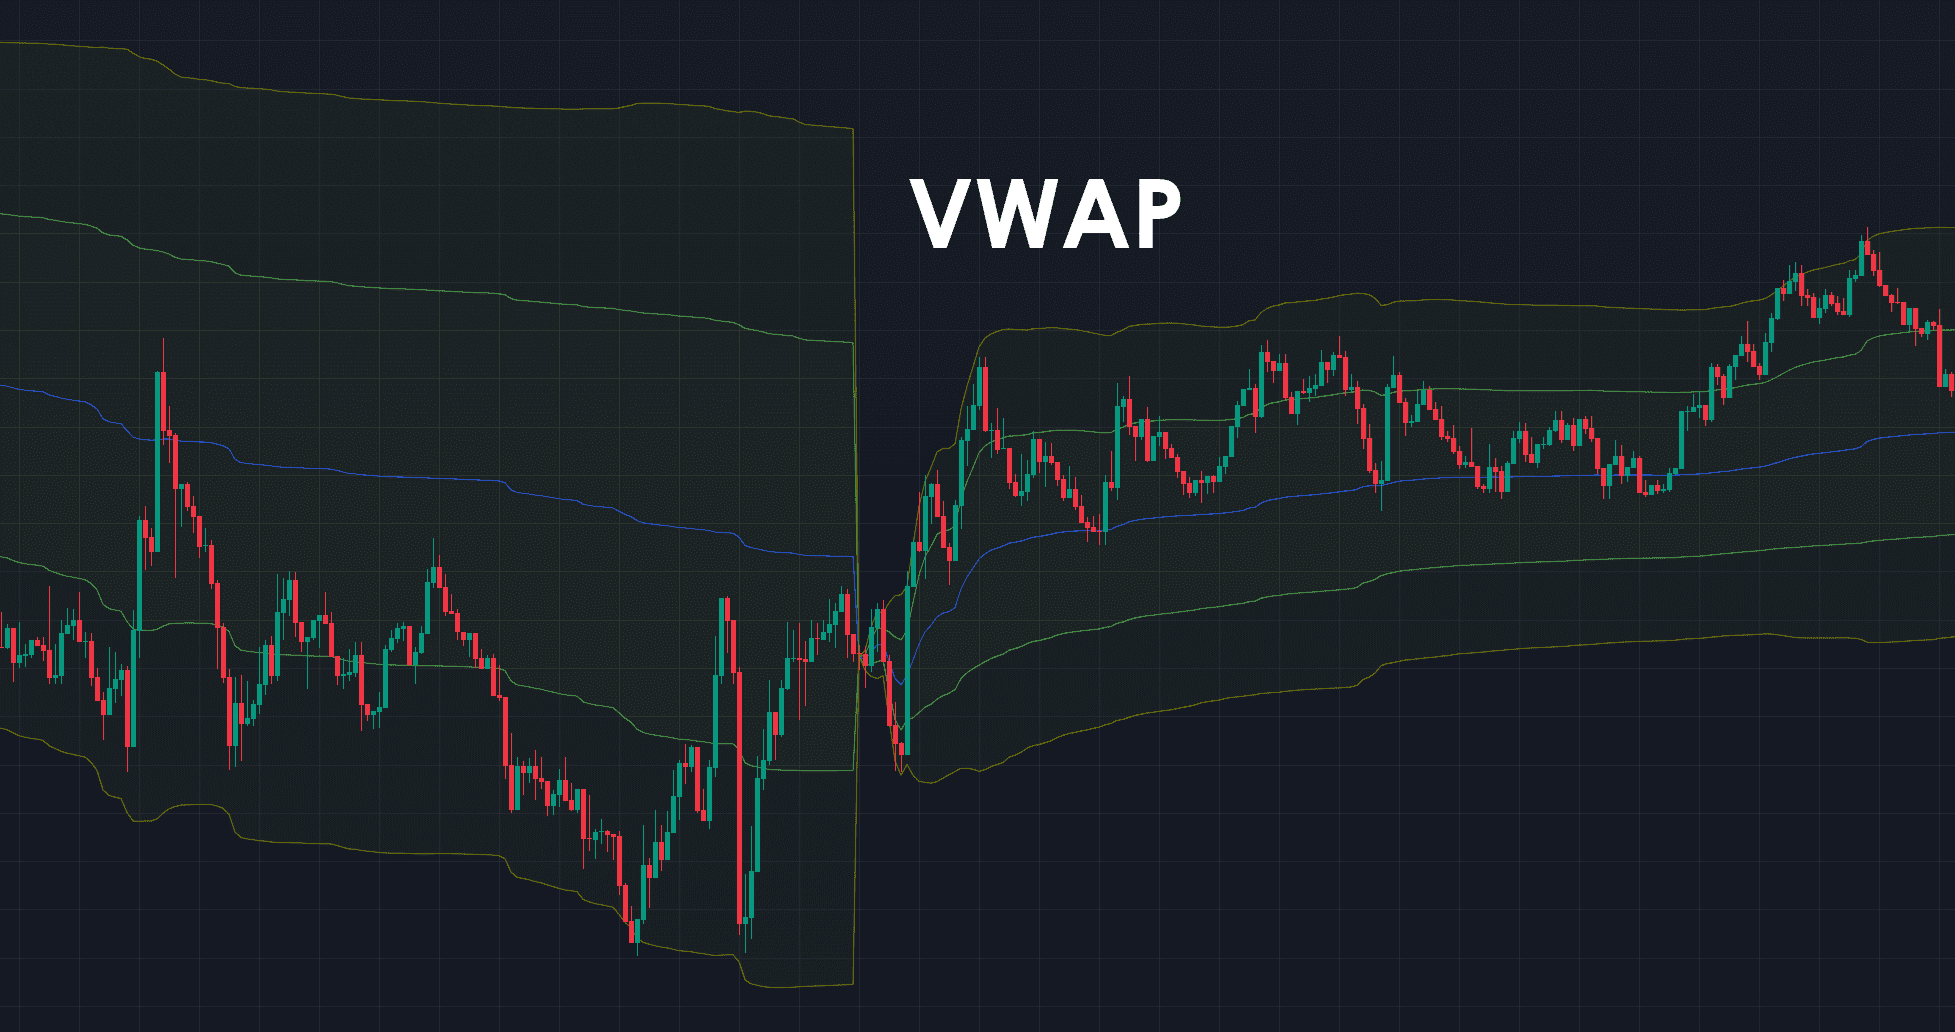
Timeframes: 2-minute chart
Indicators: VWAP (standard), VWAP deviation bands (1σ, 2σ), Volume, 20 EMA
Entry (LONG): Price deviates 2+ standard deviations below VWAP. Volume spike confirms overextension (200%+ average). Price shows rejection wicks (buying pressure). Enter when price closes back inside the 2σ band heading toward VWAP. 20 EMA supports direction.
Exit: Primary VWAP line. Extended to the opposite 1σ if momentum strong. Move to breakeven at +50% profit. Time-based exit after 20 minutes.
Stop Loss: Beyond 2.5σ band (setup invalidation)
Risk-Reward: 1:2 to 1:4 (deviation dependent)
Optimal Instruments: High-volume stocks (AAPL, MSFT, AMZN). BTC/USDT during regular hours. ES, NQ futures during liquid sessions.
Theoretical Performance Range: 62–68% win rate. 2.4–3.0 profit factor. 10–18 minutes duration. 4–8 opportunities per session.
Best Conditions: Normal distribution days, avoid major news events.
VWAP mean reversion shares conceptual ground with Smart Money Concept liquidity analysis — both methodologies treat price deviations from institutional equilibrium as opportunities rather than random noise.
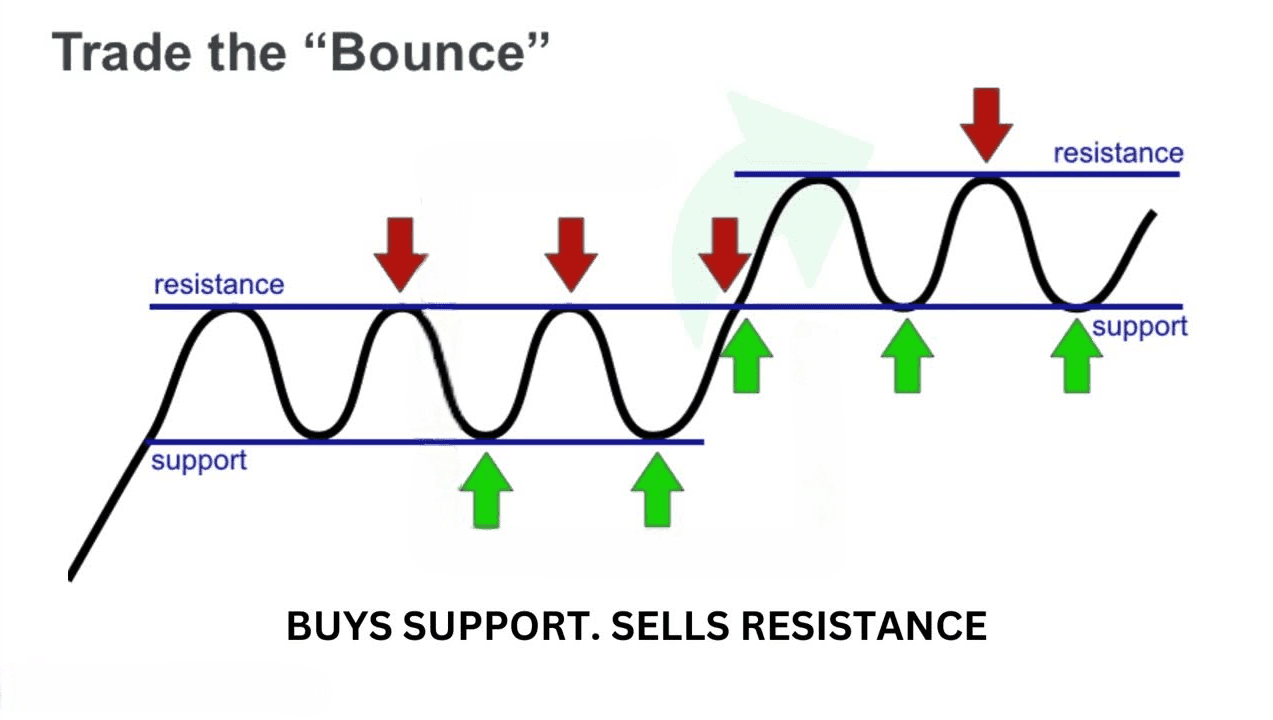
Strategy #5 — Support and Resistance Bounce
Timeframes: 15-minute for level identification, 1-minute for entry precision
Indicators: Horizontal S/R levels, Price action patterns, Volume, Optional 200 SMA
Entry (LONG at Support): Identify tested support from 15-min (minimum 3 prior touches). Price approaches on decreasing momentum. Wait for rejection pattern on 1-min: hammer, bullish engulfing, pin bar (lower wick 2x+ body length). Volume on rejection exceeds 130% average. Enter at rejection candle close or next open.
Exit: Target mid-range or next technical level. Alternative 2x ATR. Trail to breakeven after 1x ATR profit. Exit if price closes beyond level.
Stop Loss: 3–5 pips beyond S/R level (tight)
Risk-Reward: 1:2 to 1:3
Optimal Instruments: EUR/USD, USD/JPY during Asian/London. BTC/USDT, ETH/USDT at established levels. High-liquidity stocks with clear ranges.
Theoretical Performance Range: 60–65% win rate. 2.0–2.6 profit factor. 10–20 minutes duration. 3–7 level tests per session.
Best Conditions: Range-bound markets, avoid strong breakouts.
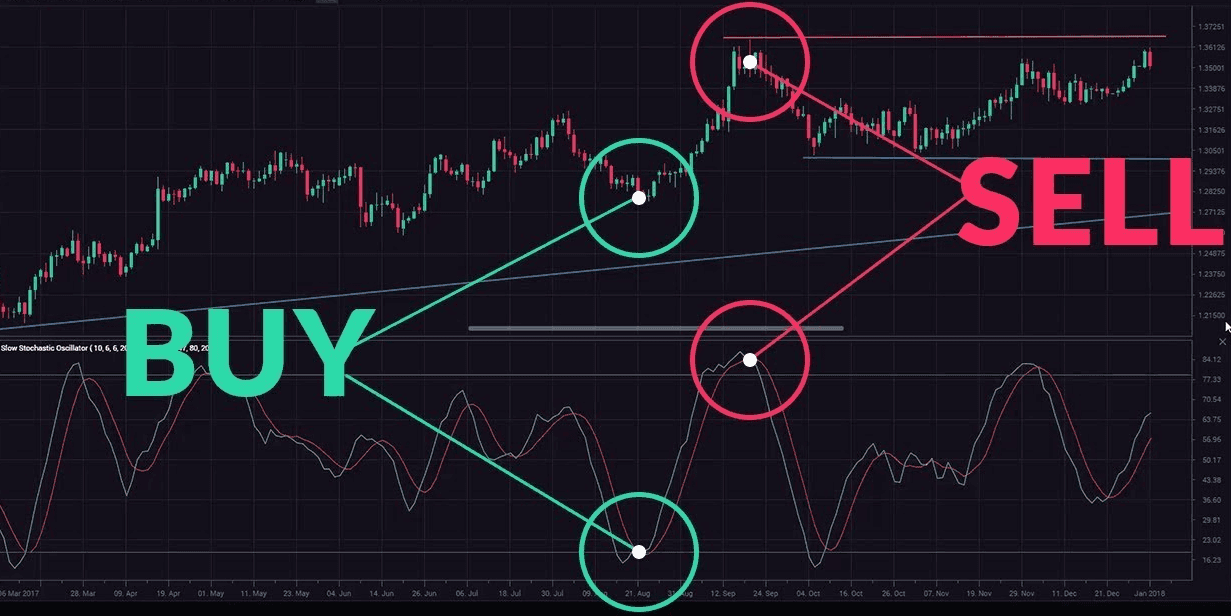
Strategy #6 — Stochastic Momentum
Timeframes: 3-minute primary
Indicators: Stochastic (5,3,3), 21 EMA, ADX(14), Volume
Entry (LONG): Price above 21 EMA (trend filter). ADX above 20 (strength filter). Stochastic drops into oversold (below 20). K crosses above D while oversold. Volume on cross exceeds average. Enter at market on cross completion.
Exit: Primary opposite stochastic cross (K crosses back below D). Alternative stochastic reaches opposite extreme (80+ for longs). Profit target 1.5x ATR if no cross. Time limit 15 minutes.
Stop Loss: Recent swing low/high on 3-min, typically 0.6x ATR
Risk-Reward: 1:1.5 to 1:2
Optimal Instruments: All major forex pairs during trends. Major crypto pairs during directional moves. Momentum stocks during trend hours (10 AM–2 PM).
Theoretical Performance Range: 57–62% win rate. 1.8–2.3 profit factor. 8–12 minutes duration. 10–18 opportunities per session (high frequency).
Best Conditions: Trending intraday environments with periodic pullbacks.
Strategy #7 — News Spike Fade

Timeframes: 1-minute for rapid execution
Indicators: Economic calendar, ATR(14), Bollinger Bands (20,2), Volume, RSI
Entry (FADE — Contrarian): Identify high-impact news (NFP, CPI, Fed decisions). Allow initial spike (first 1–3 minutes post-release). Wait for the first pullback candle. Spike magnitude must exceed 2x average ATR. Enter counter-trend when: price shows rejection candle, volume declining from peak, RSI shows divergence from extreme.
Exit: Target 50% retracement of spike (Fibonacci 50%). Alternative pre-news level. Aggressive 61.8% retracement if momentum is strong. Emergency exit if new extreme beyond spike.
Stop Loss: Beyond spike extreme plus 5 pips
Risk-Reward: 1:2 to 1:4 (spike dependent)
Optimal Instruments: Forex pairs directly affected (USD pairs for US data). BTC/USDT during major announcements. Avoid stocks (gaps).
Theoretical Performance Range: 52–58% win rate. 2.5–3.5 profit factor. 20–45 minutes duration. 1–3 major events daily.
Best Conditions: High-impact scheduled news with clear overreactions. This is the highest-skill strategy in the list and the most dangerous — news-fade against a sustained institutional move can produce catastrophic losses.
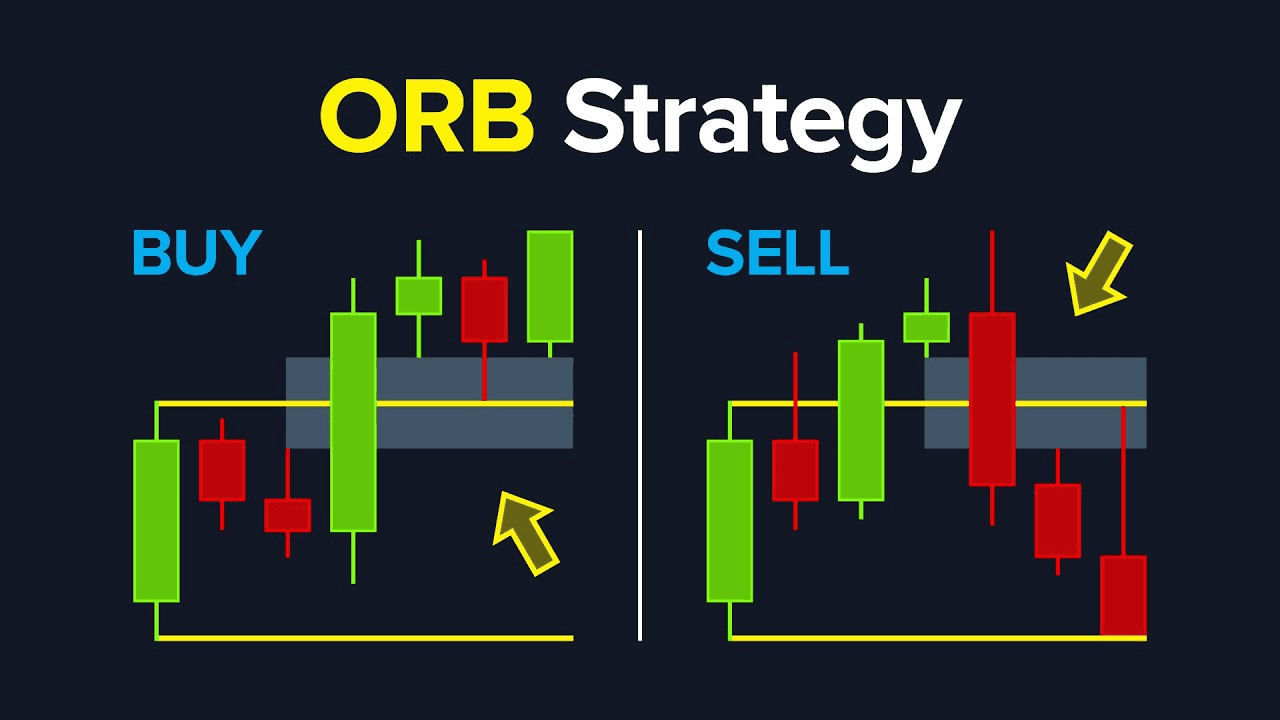
Strategy #8 — Opening Range Breakout (ORB)
Timeframes: 30-minute for range establishment, 2-minute for entry execution
Indicators: First 30-min high/low (09:30–10:00 EST stocks, 08:00 GMT forex), ATR(14), Volume profile
Entry (LONG — Upside Breakout): Mark first 30-minute high/low. After 10:00 AM, wait for price to approach range high. Breakout requirements: strong close above (not just wick), volume exceeds 150% opening range average, no immediate rejection (next candle continues). Enter at breakout close or next open.
Exit: Target 100% of opening range height projected from breakout. Alternative 2x range height if momentum is exceptional. Move to breakeven after 50% target achieved. Close before lunch (12:00 PM).
Stop Loss: Inside range, typically at midpoint
Risk-Reward: 1:2 typical (range dependent)
Optimal Instruments: SPY, QQQ, high-volume stocks. ES, NQ futures. Major forex at London open. Crypto is less reliable (24/7).
Theoretical Performance Range: 55–62% win rate. 2.1–2.7 profit factor. 30–90 minutes duration. 1–2 trades per morning.
Best Conditions: High volatility days, trending markets, post-weekend/post-news.
Advanced Strategy Combinations
Combining multiple strategies creates higher-probability setups. The confluence concept: multiple independent signals increase probability.
Hybrid #1: Triple Confirmation System — Combine MA crossover (trend direction), VWAP deviation (entry timing), Stochastic position (momentum confirmation). Trade only when all three align. This approach dramatically reduces signal frequency but improves selectivity. Example: 8 EMA crosses above 21 EMA → price deviates 2σ below VWAP → Stochastic crosses up from oversold. The entry combines trend, value, and momentum.
Hybrid #2: Structure + Momentum Fusion — Merge S/R levels (price zones) with RSI divergence (reversal timing). Result: high-probability reversals at key levels with momentum confirmation.
Hybrid #3: Volatility Breakout + Mean Reversion — Use Bollinger squeeze to identify compression. Apply VWAP strategy during expansion. Captures both breakout and subsequent reversion.
| Approach | Theoretical Win Rate | Profit Factor | Signals/Day |
|---|---|---|---|
| Single Strategy | ~58% | ~1.9 | 12 |
| Hybrid (2 filters) | ~67% | ~2.4 | 6 |
| Hybrid (3 filters) | ~74% | ~3.1 | 3 |
More filters means fewer signals but higher quality. Trade less, win more. Start with single strategies, master them individually, then experiment with combinations. This aligns with PipFarm data showing 45.1% of successful prop traders make just 1–2 trades per day — selectivity beats volume.
Strategy Comparison and Selection Guide
Which strategy to start with? Complete comparison across key metrics (all values theoretical):
| Strategy | Win Rate | Profit Factor | Trades/Day | Difficulty | Capital |
|---|---|---|---|---|---|
| MA Crossover | ~60% | ~1.9 | 10–15 | Beginner | Low |
| BB Squeeze | ~58% | ~2.3 | 3–6 | Intermediate | Medium |
| RSI Divergence | ~68% | ~2.6 | 2–4 | Advanced | Medium |
| VWAP Reversion | ~65% | ~2.7 | 5–8 | Intermediate | Medium |
| S/R Bounce | ~63% | ~2.2 | 4–7 | Beginner | Low |
| Stochastic | ~60% | ~1.9 | 12–18 | Beginner | Low |
| News Fade | ~55% | ~3.0 | 1–3 | Expert | High |
| Opening Range | ~59% | ~2.4 | 1–2 | Intermediate | Medium |
Selection Guide: Beginners with limited capital should start with MA Crossover or S/R Bounce. Intermediate experience with moderate capital works well with VWAP or BB Squeeze. Experienced traders with substantial capital can implement RSI Divergence or News Fade. For high-frequency preference, deploy Stochastic or MA Crossover. For selective high-probability trades, focus on RSI Divergence or BB Squeeze.
Backtesting Methodology
Theory means nothing without testing. A systematic approach to validating strategies before risking capital:
Step 1: Historical Data Collection — Minimum 6 months of data covering various conditions (trend, range, volatile). Tick data is preferred, 1-minute minimum for scalping.
Step 2: Parameter Testing — Test indicator parameters (EMA periods, RSI settings). Use optimization software like TradingView, AmiBroker, or Python libraries. Avoid testing 20+ parameters simultaneously — that's curve fitting, not optimization.
Step 3: Walk-Forward Analysis — Optimize on 70% of data (training). Test on remaining 30% (out-of-sample verification). Roll forward repeatedly. The strategy must perform on out-of-sample periods. If it only works on training data, you've curve-fit.
Step 4: Monte Carlo Simulation — Randomize trade sequences. Measure maximum drawdown across 1000+ simulations. Ensure the strategy survives unlucky periods. If the 95th percentile drawdown exceeds 25%, the strategy is too risky.
Step 5: Live Demo Testing — 2–3 months real-time paper trading. Match backtested results within 15–20% tolerance, adjusted for slippage and commissions.
Warning: A strategy that works in backtest but fails live usually indicates overfitting, insufficient slippage modeling, or a market regime change.
Hypothetical Strategy Examples
The following examples illustrate how each strategy looks in execution. They are hypothetical scenarios for educational purposes, not records of actual trades.
Example #1 — MA Crossover (EUR/USD): London session, trending day. 8 EMA crosses 21 EMA at 1.0845. Entry on pullback to 8 EMA at 1.0838 with RSI confirmation above 50. Stop at 1.0833 (6 pips). Target 1.0848 (9 pips). Position held ~11 minutes before target hit. Analysis: Strong trend creates ideal conditions; clean pullback provides low-risk entry.
Example #2 — VWAP Reversion (BTC/USDT): US hours, normal distribution day. Price spikes to $41,250 (2.3σ below VWAP at $41,680). Volume spike to 240% average. Entry at $41,280 on rejection. Stop at $41,150. Target VWAP at $41,680. Position held ~18 minutes. Analysis: Textbook overextension with volume confirming exhaustion before reversion.
Example #3 — RSI Divergence (AAPL): Mid-morning, intraday correction. Price makes higher high at $178.65. RSI makes lower high (bearish divergence). Entry short at $178.40 on stochastic confirmation. Stop at $178.75. Target at 50 EMA near $177.55. Position held ~24 minutes. Analysis: Patience waiting for divergence pays off versus jumping into momentum trades without confirmation.
Common Strategy Mistakes
Even the best strategies fail when executed incorrectly.
Mistake #1: Trading Every Signal — Taking 80% of signals instead of the best 20% destroys edge. The fix: add confluence filters, reduce frequency, improve selectivity. Traders who filter aggressively often improve win rates by 8–12% with half the trades.
Mistake #2: Inconsistent Parameters — Changing EMA periods or RSI settings mid-session prevents proper strategy evaluation. Lock parameters for a minimum of 100 trades before adjusting. Without consistency, you can't distinguish between a bad strategy and bad execution.
Mistake #3: Ignoring Market Regime — Using momentum strategies in range-bound markets. The daily market assessment at session start — ADX, ATR, Bollinger Band width — isn't optional. Skipping it eliminates the primary edge of the framework.
Mistake #4: Premature Position Sizing — Using full size before the strategy is proven. Use 25% size for the first 50 trades, 50% for the next 50, and full size only after 100+ consistent trades. This limits drawdown during the learning phase.
Mistake #5: No Post-Trade Review — Repeating the same mistakes forever. Journal every trade and run weekly pattern analysis. According to a PipFarm survey of 2,777 prop traders, 37.8% cite lack of discipline as their primary failure mode — and inconsistent review is exactly how undisciplined patterns calcify into permanent weaknesses. For a deeper breakdown of execution psychology and how losses become structural problems, see the "Best Loser Wins" framework and the five types of trading tilt.
Strategy Adaptation for Different Markets
Forex, crypto, and stocks have unique characteristics. Adapt strategies accordingly.
Forex: Best strategies are MA Crossover, VWAP, and Stochastic Momentum. High liquidity supports high frequency; tight spreads enable scalping. Optimal pairs: EUR/USD, GBP/USD, USD/JPY. Standard parameters work well. Focus on the London/NY overlap (08:00–12:00 EST). Key considerations: spread sensitivity, swap fees (rare for scalpers), major news impact.
Crypto: Best strategies are VWAP Mean Reversion, Bollinger Squeeze, and RSI Divergence. Volatility-focused strategies match crypto's explosive moves. Stick to BTC/USDT and ETH/USDT — liquidity is essential, avoid low-liquidity altcoins. Parameter adjustments: wider stops (+30%), larger targets (+40%). Focus US hours (09:00–16:00 EST) despite 24/7 markets. Key considerations: exchange risk, funding rates, weekend volatility, sudden regulatory news. Maxim, profiled in verified prop trading success stories, applies similar selectivity principles to SMC-based crypto trading, generating results through 1–2 quality trades per day rather than high-frequency scalping.
Stocks: Best strategies are Opening Range Breakout, S/R Bounce, and News Fade. Focus on SPY, QQQ, and high-volume stocks (AAPL, MSFT, TSLA). Account for wider spreads and commissions. Respect the Pattern Day Trader rule ($25,000 minimum in the US). Focus on the first 2 hours post-open (09:30–11:30) and power hour (3–4 PM). Avoid lunch hours. Key considerations: gap management, earnings announcements, sector rotation.
Key Takeaways
Eight scalping strategies, one honest truth: the frameworks don't make money — disciplined execution does. Every win rate and profit factor in this guide is a theoretical ceiling achievable only when the strategy matches the market condition, the setup meets all confluence criteria, position sizing stays within risk limits, and emotional reactions don't override the rules. Most traders who adopt scalping fail not because the strategies are wrong, but because they take 80% of signals instead of the best 20%, trade through unfavorable conditions, and skip the post-trade review that would reveal their weaknesses.
The research is blunt about high-frequency trading: Barber and Odean's study of 66,465 households showed that the most active retail traders underperformed the market by 6.5 percentage points annually, and PipFarm's 2025 survey found that 45.1% of successful prop traders make only 1–2 trades per day. The traders who succeed at scalping do so by treating it as a precision instrument — used selectively, not constantly. Pick one or two strategies. Master them on demo for 100+ trades before going live. Start with 25% position sizing. Track every trade. Scale up only after consistent results emerge across varied market conditions. The path from strategy knowledge to consistent execution is measured in months, not weeks.
Implementation Roadmap: Week 1 — Select 2 strategies, create checklists. Months 1–3 — Demo trade extensively (100+ trades per strategy). Month 4 — Optimize and refine based on journal data. Month 5+ — Begin live trading with 25% position size, scale gradually only after demonstrating consistency.
Ready to start your prop trading journey?
Start now: 👉 Upscale.trade | Telegram Bot
Follow us: 📺 YouTube | 𝕏 Twitter
Frequently Asked Questions
What is the best scalping strategy for beginners?
Moving Average Crossover or Support/Resistance Bounce offer the clearest visual signals and lowest complexity for newcomers. Both provide theoretical win rates around 60–63% when executed according to rules, and neither requires advanced market structure understanding. Start with one of these on a demo account for at least 100 trades before introducing complexity. Mastering one strategy completely outperforms dabbling in several.
How many scalping strategies should I use simultaneously?
Master one or two strategies before adding more. The temptation to learn everything at once prevents deep understanding of any single approach. Experienced scalpers maintain arsenals of 4–5 strategies maximum, deploying specific ones based on market conditions. Quantity of strategies doesn't correlate with profitability — depth of execution does.
What win rate is realistic for scalping strategies?
Realistic ranges span 55–70% depending on selectivity. High-frequency approaches (10+ trades per session) typically produce 55–60% win rates, while high-selectivity methods (2–4 trades per session) can reach 65–70%. Focus on profit factor rather than win rate alone — a 55% win rate with 3:1 risk-reward outperforms a 70% win rate with 1:1. According to a PipFarm survey of 2,777 prop traders, 45.1% of successful prop traders make only 1–2 trades per day, suggesting high selectivity correlates with success more than high frequency.
How long does it take to master a scalping strategy?
Expect 3–6 months of focused practice for genuine proficiency. Month 1 is pure learning and pattern recognition. Months 2–3 build basic competence on demo. Months 4–6 develop consistency across varied market conditions. Skipping the demo phase or rushing into live trading before consistency is the primary reason most scalpers fail.
Can scalping strategies be automated?
Partially. Mechanical strategies with clear rules like MA Crossover and Stochastic Momentum automate relatively well using trading bots or algorithms. Complex discretionary strategies like RSI Divergence or News Fade are difficult to fully automate because they require contextual judgment about market conditions, news impact, and confirmation patterns that aren't easily coded into hard rules.
What's the biggest risk in scalping compared to swing trading?
Execution costs destroy scalping profitability faster than any other factor. A swing trader paying $0.50 in spread plus commission per trade absorbs that cost across 100+ pips of profit. A scalper paying the same cost across 10 pips of profit gives up 5% of every win to execution. Combined with the psychological toll of high-frequency decision-making, this is why Barber and Odean (2000) found that the most active retail traders underperformed the market by 6.5 percentage points annually. Scalping only works with tight spreads, low commissions, and ruthless selectivity.
Is scalping suitable for prop trading challenges?
Scalping can work in prop challenges, but the structural constraints favor lower-frequency approaches. Daily drawdown limits punish scalpers who hit a rough 30-minute stretch, and most prop firms enforce minimum trading day requirements that reward consistency over volume. PipFarm data showing 45.1% of successful prop traders make just 1–2 trades per day suggests that pure scalping strategies (10–18 trades daily) create more drawdown risk than they eliminate. Selective scalping — using high-confluence filters to trade 2–4 times per session — aligns better with prop trading constraints.