VWAP Trading Guide: Formula, Strategies & Crypto | Upscale


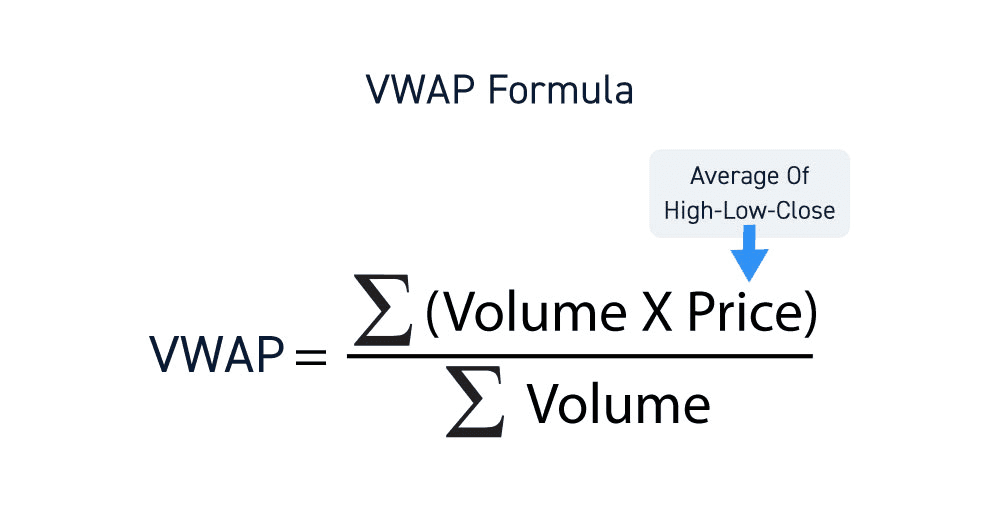
The Volume-Weighted Average Price (VWAP) is the average price of an asset traded over a specific period, weighted by trading volume rather than time. The formula is: VWAP = Σ(Typical Price × Volume) ÷ Σ(Volume), where Typical Price for each period equals (High + Low + Close) ÷ 3, and the sums accumulate from the start of the chosen session. VWAP was introduced as an institutional execution benchmark in Berkowitz, Logue, and Noser (1988), published in the Journal of Finance, where the authors proposed it as a measure of trade execution quality on the NYSE — buying below VWAP indicates favorable execution, selling above indicates the same. Since then it has become a standard tool both for institutional execution algorithms and for retail intraday trading. The line resets at the start of each trading session in the standard implementation. Anchored VWAP, popularized by trader and educator Brian Shannon, allows manually setting the starting point to a significant event (an earnings release, a major news catalyst, the start of a major move), making the indicator usable for multi-day or even multi-week analysis. In cryptocurrency markets, where the 24/7 schedule eliminates traditional session breaks, anchored VWAP is the dominant variant — anchored to news events, range breakouts, or the start of a new trend.
What VWAP Measures
VWAP answers a specific question: at what average price has this asset actually traded today, weighted by how much volume occurred at each price level? Two periods can have identical price action but very different VWAPs if volume distribution differs. A morning that opened flat with low volume and rallied on heavy volume produces a VWAP closer to the high of the day than a simple time-weighted average would suggest, because the high-volume period dominates the calculation.
This is why VWAP is the institutional execution benchmark and a simple moving average is not. When a fund needs to buy 500,000 shares over a session, "execution at the average price" really means "execution at the volume-weighted average price" — because that's the price at which the actual market activity occurred. Beating VWAP (buying below it on accumulation, selling above it on distribution) is a measurable edge that gets reported up to the fund's clients as evidence of skilled execution.
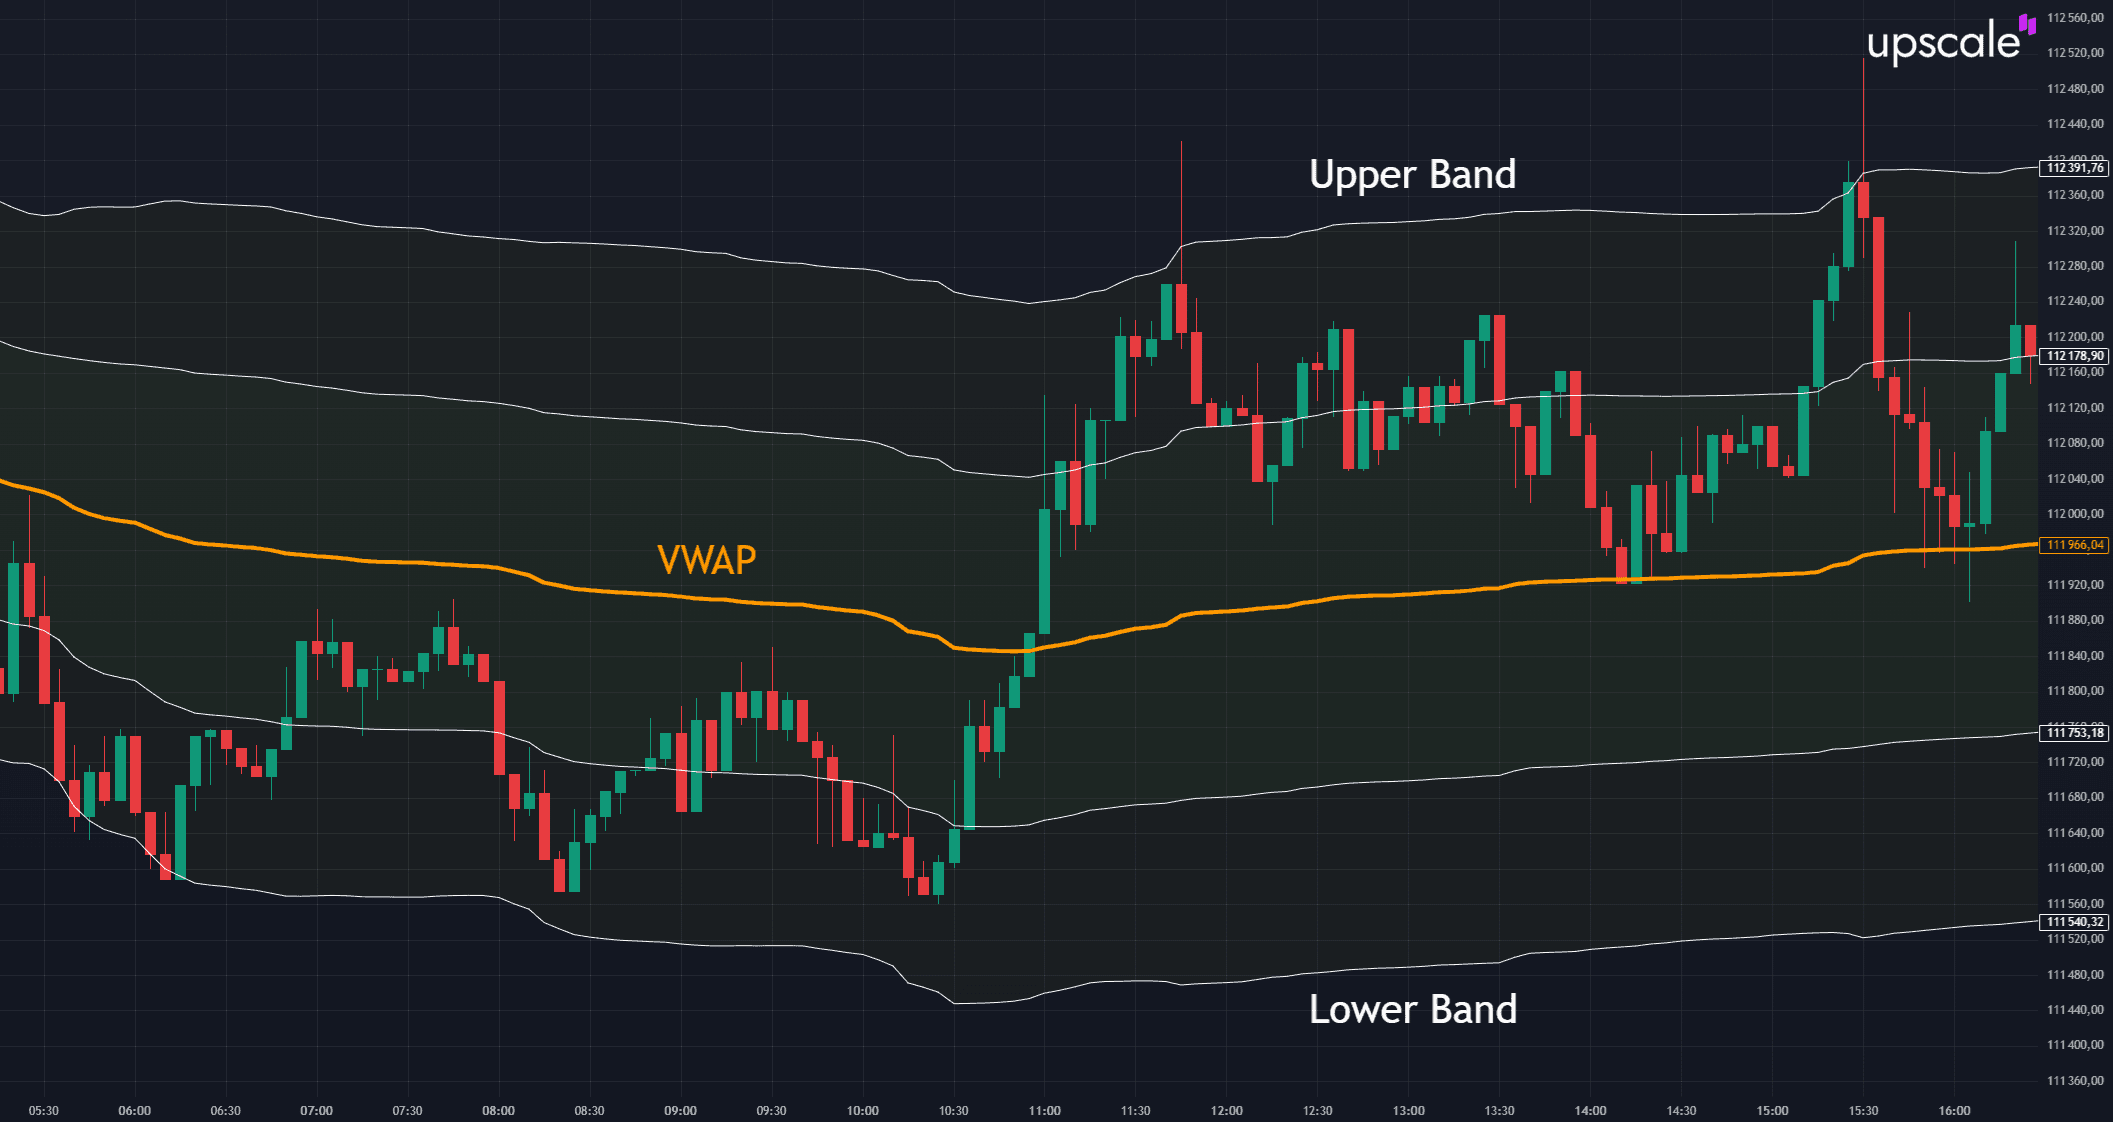
For retail traders, the same property makes VWAP useful as a fair-value reference. Price trading well above VWAP indicates buyers have been aggressive throughout the session and current price reflects above-average buying pressure. Price below VWAP indicates the opposite. Price oscillating around VWAP indicates balanced two-way activity. The line itself functions as dynamic support in uptrends (price tends to bounce from it during pullbacks) and dynamic resistance in downtrends (price tends to reject it on rallies).
How to Calculate VWAP
The standard VWAP formula:
VWAP = Σ(Typical Price × Volume) ÷ Σ(Volume)
Where:
- Typical Price for each period = (High + Low + Close) ÷ 3
- Volume for each period = number of contracts/shares/units traded
- Σ indicates the cumulative sum from the start of the session to the current period
Worked Example
Assume a 5-minute chart with the first three candles of a session:
| Period | High | Low | Close | Typical Price | Volume | TP × Volume |
|---|---|---|---|---|---|---|
| 1 | $100.20 | $99.80 | $100.10 | $100.03 | 10,000 | $1,000,300 |
| 2 | $100.50 | $100.10 | $100.40 | $100.33 | 15,000 | $1,504,950 |
| 3 | $100.80 | $100.30 | $100.60 | $100.57 | 20,000 | $2,011,400 |
After period 3:
- Cumulative Σ(TP × Volume) = $1,000,300 + $1,504,950 + $2,011,400 = $4,516,650
- Cumulative Σ(Volume) = 10,000 + 15,000 + 20,000 = 45,000
- VWAP = $4,516,650 ÷ 45,000 = $100.37
The line continues to extend with each new period, with each new (Typical Price × Volume) term added to the numerator and each new Volume added to the denominator. The line cannot move sharply once cumulative volume is large — by mid-session, no single period's volume is enough to shift VWAP meaningfully. This is why VWAP becomes a stable reference as the session progresses, while early-session VWAP is more volatile.
In practice, no trader calculates this manually. Every charting platform computes VWAP automatically — the worked example matters only because understanding the math reveals why the indicator behaves the way it does (slow to react late in session, sensitive early, dominated by high-volume periods).
Standard vs. Anchored VWAP
The standard VWAP resets at the start of each trading session — for US equities, that means 9:30 AM ET on each weekday, with the calculation accumulating until 4:00 PM ET. This makes standard VWAP an intraday-only indicator; multi-day analysis with the standard variant produces a series of disconnected daily VWAP lines rather than a continuous reference.
Anchored VWAP allows the trader to manually set the starting point. Once anchored, the calculation proceeds identically — Σ(TP × Volume) ÷ Σ(Volume) from the anchor point forward. This unlocks several use cases impossible with the standard variant:
- Earnings anchors: anchor VWAP to the close of the day before an earnings release. The resulting line shows the volume-weighted average price for everyone who traded after the earnings reaction.
- Major news anchors: anchor to a Fed announcement, a CPI release, or a major geopolitical event. Price's relationship to that anchored VWAP shows how all subsequent participants are positioned relative to the news-reaction price.
- Swing high/low anchors: anchor to a significant pivot. The line shows the average price at which the move from that pivot has occurred.
- Range breakout anchors: anchor to the breakout candle from a consolidation. Subsequent price action against the anchored line measures whether the breakout is being defended.
Anchored VWAP is associated with trader and educator Brian Shannon, who popularized its use in his book on multiple-timeframe analysis. The technique addresses a fundamental limitation of standard VWAP: most meaningful market structure does not align with arbitrary session boundaries.
For cryptocurrency markets, anchored VWAP is essentially mandatory because crypto trades 24/7 and has no natural session breaks. Bitcoin traders typically anchor VWAP to major events: a Federal Reserve announcement, a major exchange event (FTX collapse, Binance regulatory action), an ETF approval, or a high-timeframe range breakout. The resulting line provides a meaningful average-price reference where standard VWAP would produce a continuously running calculation with no clear interpretation.
VWAP vs. TWAP
The Time-Weighted Average Price (TWAP) is VWAP's simpler cousin: it averages the typical price over time without weighting by volume. The formula is just Σ(Typical Price) ÷ N, where N is the number of periods. TWAP treats every minute equally — a quiet 10:00 AM minute counts the same as a chaotic 3:55 PM minute heavy with closing-bell flow.
TWAP exists because some institutional execution strategies prefer it. A fund that wants to disguise its trading activity may execute steadily across the session in equal time increments, regardless of where the natural volume occurs. Beating TWAP on such a strategy means beating the time-distributed average, which serves a different purpose than beating VWAP.
For analytical purposes, VWAP is almost always the more useful indicator because it captures where actual trading activity occurred. TWAP is useful for execution algorithms but rarely useful as a chart reference for discretionary traders. The exception is in markets where volume data is unreliable or unavailable — TWAP can serve as a fallback approximation in those cases.
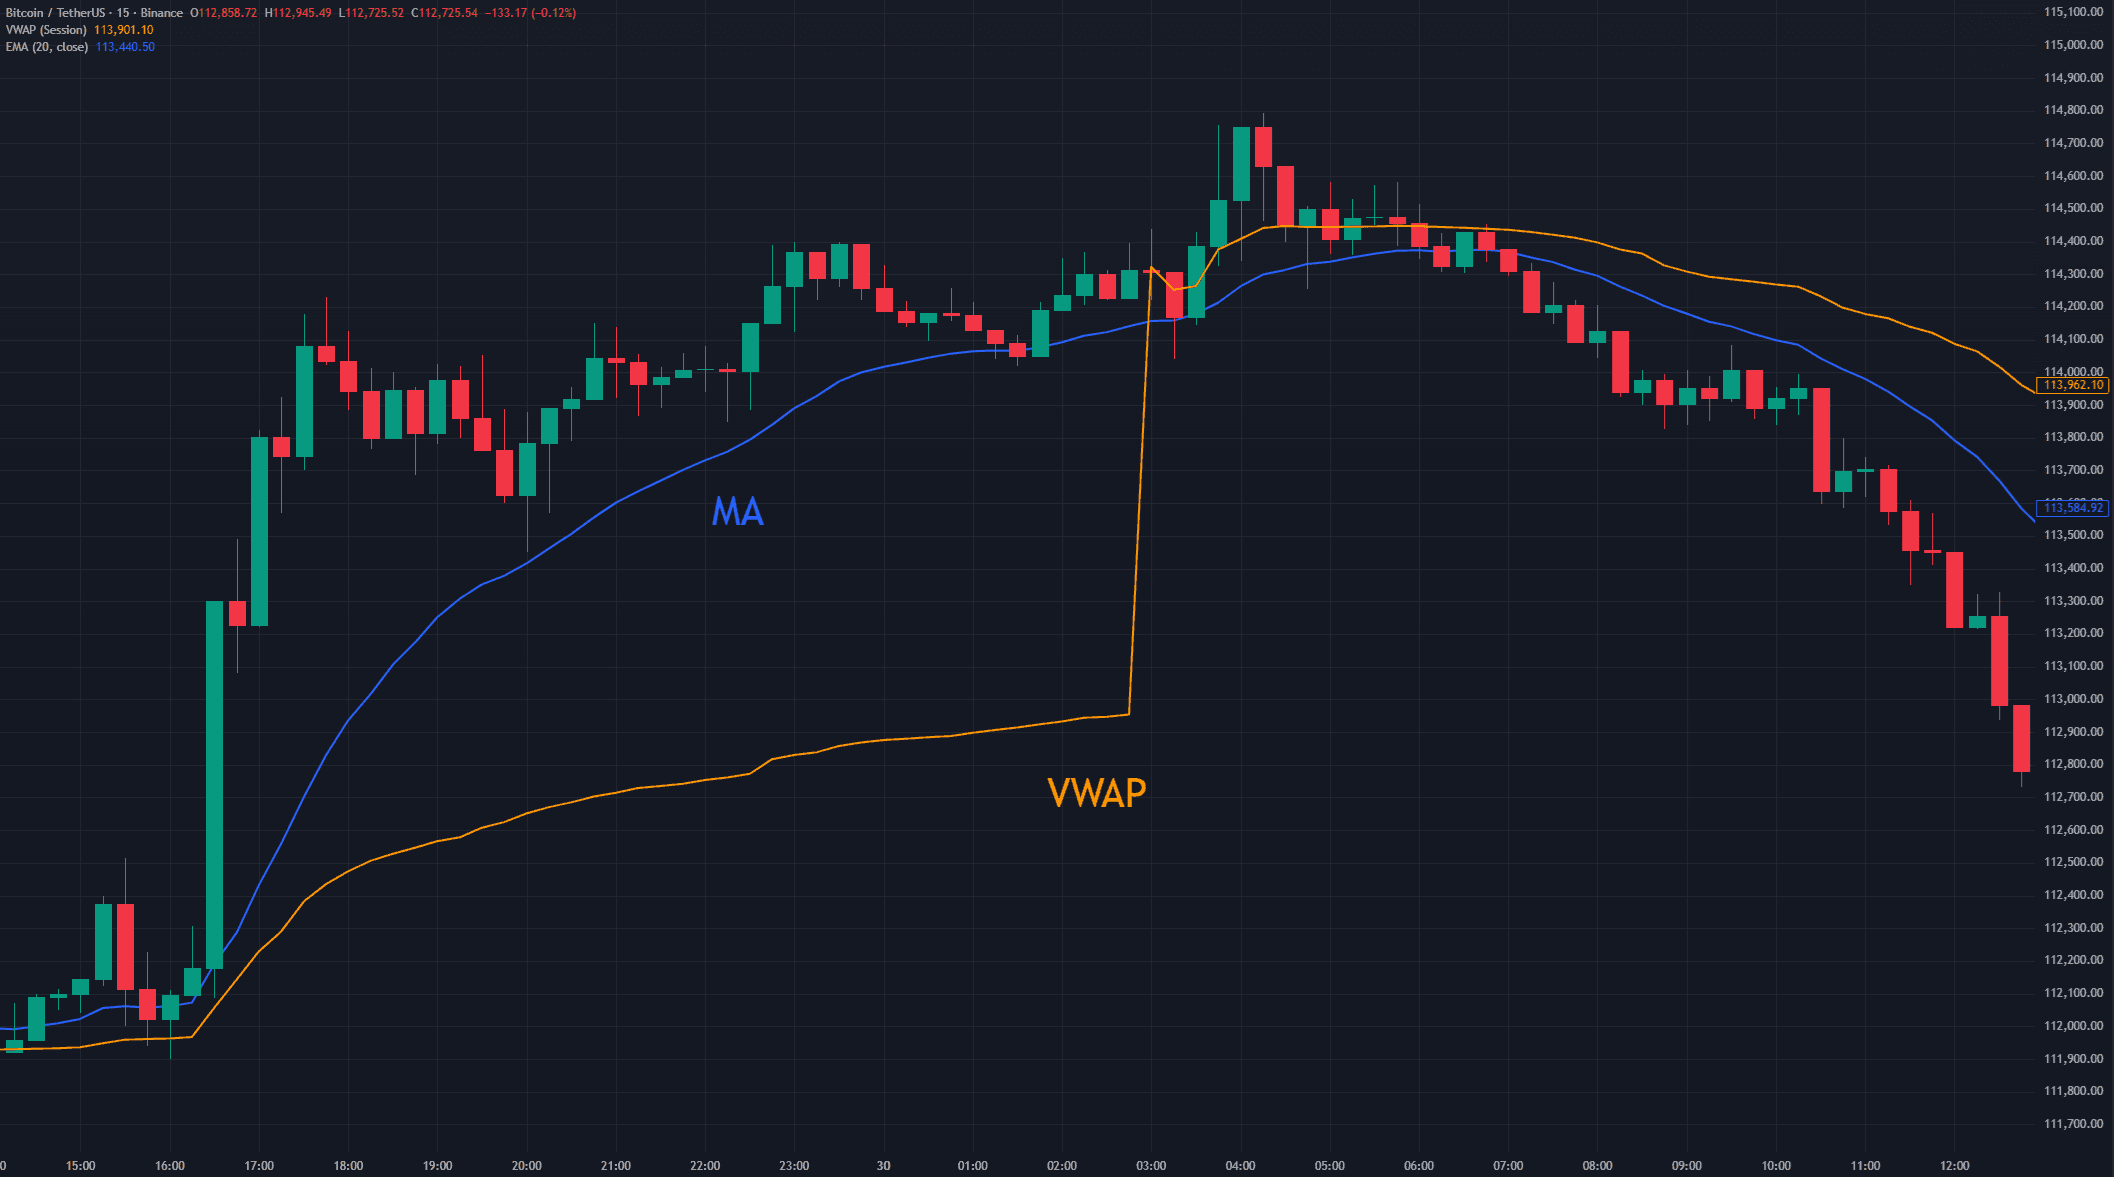
VWAP vs. Moving Averages
The Simple Moving Average (SMA) of period N averages the last N closes equally, regardless of volume or session position. The Exponential Moving Average (EMA) weights recent prices more heavily but still ignores volume. Neither captures the volume distribution that defines where actual trading occurred.
The practical implications:
- SMAs and EMAs are continuous across sessions. They use the last N candles regardless of what those candles represent. A 50-EMA on a daily chart spans roughly 2.5 months of trading. VWAP resets each session by default.
- Moving averages lag. They smooth past prices but don't react to volume shifts. VWAP responds dynamically to volume — a sudden volume spike at a particular price pulls VWAP toward that price proportionally.
- VWAP is anchored to a starting point (session open, or manual anchor for AVWAP). Moving averages have no anchor — they're a rolling window that follows price wherever it goes.
For intraday trading, VWAP is generally more informative than short-period moving averages because it captures the actual volume-weighted equilibrium price for the session. For multi-day or multi-week analysis, moving averages remain useful for trend identification, while anchored VWAP serves as a complementary tool for measuring price relative to specific events. The two are not substitutes — they answer different questions and most professional traders use both.
Trading Strategies Using VWAP
VWAP supports several distinct strategies depending on market conditions and trader objectives. The same line that signals trend continuation in one regime signals mean reversion in another, so reading market context matters more than mechanically applying one rule.
VWAP as Dynamic Support and Resistance
The most common application: in an uptrend, price tends to pull back to VWAP and then resume the move higher. In a downtrend, price tends to rally to VWAP and then resume lower. The line acts as a fair-value reference that the market repeatedly tests during trending sessions.
Long setup (uptrend session): Price has established an uptrend with rising VWAP. Price pulls back toward VWAP. Buy on the bounce off VWAP with a stop just below the line. Target the prior swing high or use a trailing stop to capture continued trend strength.
Short setup (downtrend session): Mirror image. Price in a downtrend rallies toward VWAP. Sell the rejection with a stop just above. Target the prior swing low.
The signal works best when VWAP itself is sloping in the trend direction — flat VWAP indicates a balanced session where bounce/rejection signals are less reliable.
VWAP Breakout Trades
When price has spent the session below VWAP and then breaks above it on increasing volume, the VWAP cross can signal the end of seller dominance and the start of buyer control. Mirror image for crosses below VWAP after extended sessions above.
The breakout signal requires volume confirmation. A VWAP cross on declining volume is more likely to fail than one on volume expansion. The breakout is also stronger when it occurs during the active trading hours of the session — a VWAP cross in the final 15 minutes carries less weight than one mid-session.
Mean Reversion at VWAP Bands
Many platforms display VWAP with standard deviation bands (typically ±1, ±2 standard deviations from the VWAP line). When price extends to ±2 standard deviation bands, the move is statistically extreme relative to session volatility, and mean reversion back toward VWAP becomes more likely.
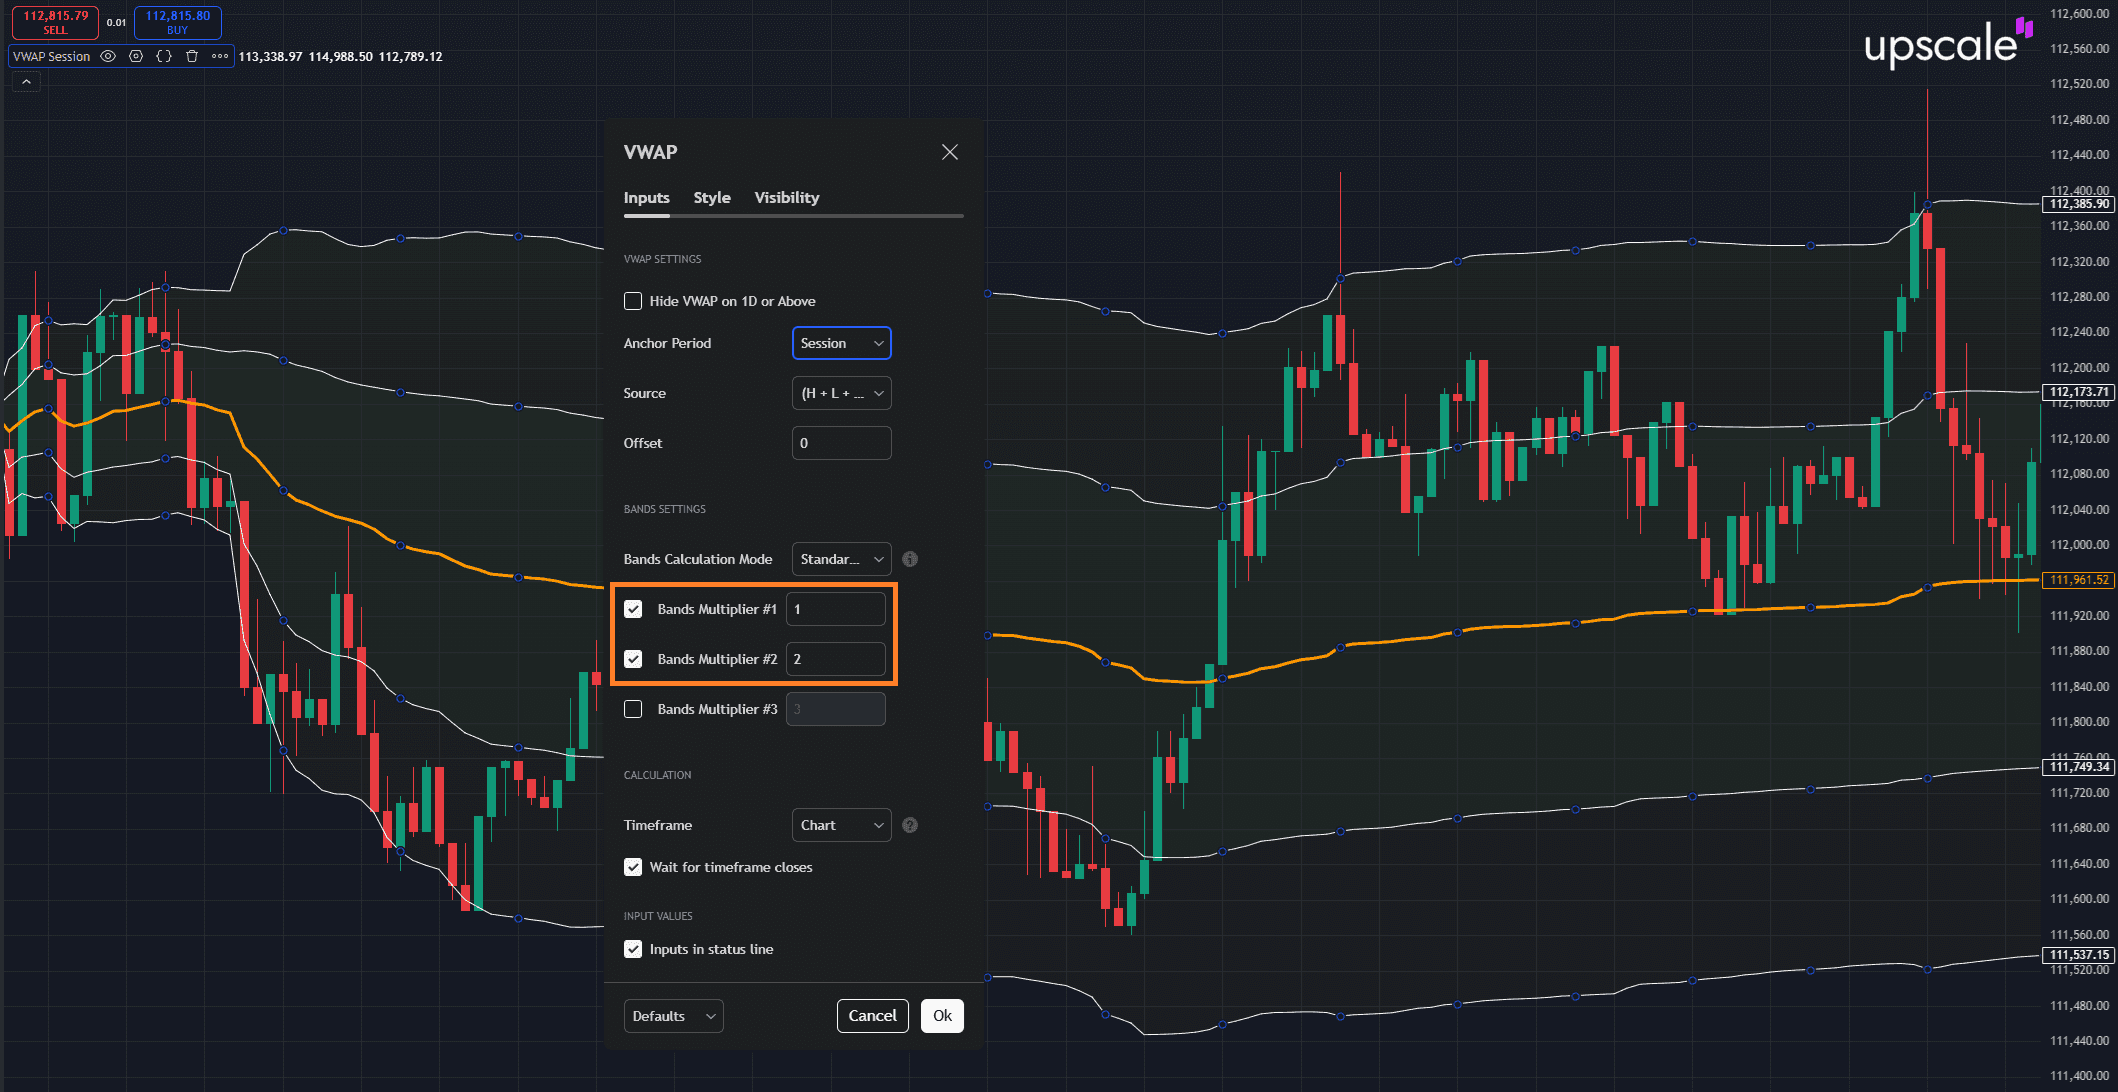
Configuring VWAP standard deviation bands in TradingView. Bands Multiplier #1 (multiplier 1) and Bands Multiplier #2 (multiplier 2) are enabled — the chart displays the VWAP line (orange) with two pairs of bands: ±1σ (inner) and ±2σ (outer). Touches of the outer ±2σ bands often mark mean reversion zones.
This is conceptually similar to Bollinger Band trading but with VWAP rather than a moving average as the centerline — and the volume weighting often produces tighter, more meaningful bands than time-weighted Bollinger calculations. For traders who use scalping approaches, VWAP bounce trades are one of the eight strategies covered in our best scalping strategies guide.
Anchored VWAP for Swing Trading
Anchor VWAP to a major event (earnings, Fed announcement, range breakout). The anchored line then becomes a multi-day support/resistance reference. Long positions held above the anchored VWAP have positive average return relative to the anchor; short positions below have positive average return. When price closes through the anchored VWAP after holding one side for an extended period, the average-cost regime has shifted.
This approach is particularly useful for swing traders who want to use VWAP-style analysis but need a reference that persists across multiple days. The technique also works in crypto markets where standard VWAP is less applicable due to 24/7 trading.
Common Mistakes When Using VWAP
Several errors recur often enough that recognizing them is more useful than memorizing additional setups.
Using VWAP outside its intended timeframe. Standard VWAP is an intraday indicator. Trying to use it for multi-day swing analysis produces a series of disconnected daily lines and inconsistent signals. For multi-day analysis, use anchored VWAP with a meaningful anchor point, or use moving averages as the appropriate substitute.
Trading VWAP signals on low-volume sessions. VWAP becomes less meaningful when overall session volume is light — early summer Fridays, days before holidays, sessions during major news distraction in unrelated markets. Low volume means each tick has disproportionate weight on VWAP, producing erratic line behavior that doesn't reflect genuine fair-value information.
Ignoring volume distribution within the session. A session where volume is heavily concentrated at the open can produce a misleading VWAP for late-session trading decisions. By 3 PM in such a session, the VWAP is dominated by morning prices that may no longer reflect intraday equilibrium. Profile volume distribution analysis (often visualized via volume profile alongside VWAP) addresses this.
Treating VWAP crosses as standalone signals. Price crosses VWAP many times during a typical trading day, especially in sideways sessions. Each cross is not a trade signal — most are noise. Confirming with volume expansion, momentum shift, or alignment with a higher-timeframe trend filter eliminates the majority of false crosses.
Assuming VWAP works the same in all markets. US equity VWAP behaves predictably because US markets have well-defined sessions, deep liquidity, and consistent volume patterns. Crypto VWAP requires anchored variants because there are no sessions. Forex VWAP works during specific liquidity windows (London open, NY open) but is less meaningful during the Asian session for major pairs. Strategy adjustments are required for each market.
Combining VWAP With Other Indicators
VWAP is most reliable when used as one input within a multi-indicator framework. Used alone it produces too many signals to act on profitably; used as a filter it improves the quality of signals from other tools.
VWAP + RSI: Use RSI on a lower timeframe to confirm bounces off VWAP. A bounce off VWAP that coincides with RSI exiting oversold (in an uptrend) or overbought (in a downtrend) is more reliable than the bounce alone. Conversely, an RSI divergence with VWAP cross can signal a regime change before price confirms.
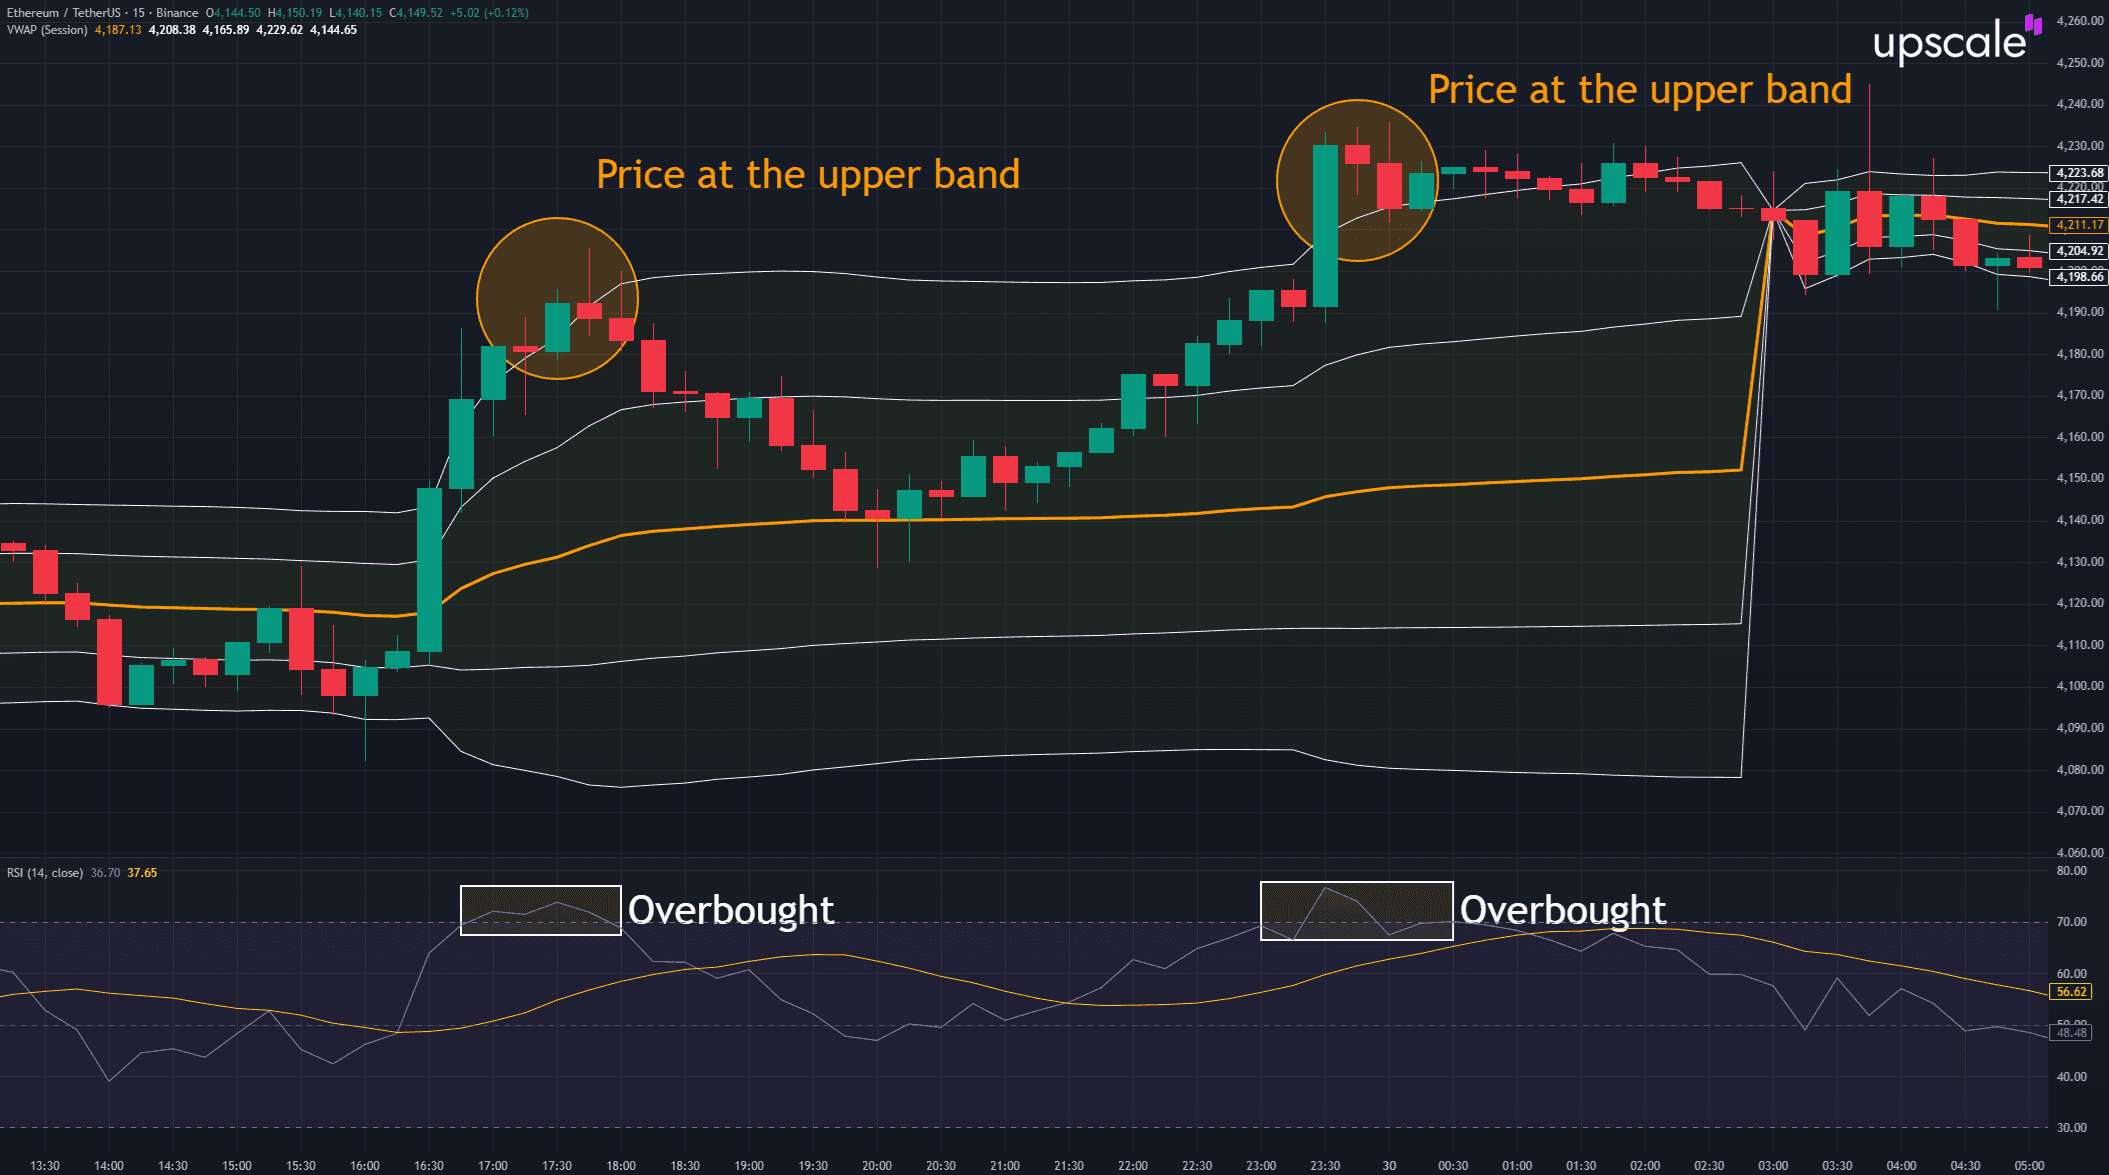
VWAP + RSI on a 15M ETH/USDT chart. Two touches of the upper VWAP band ("Price at the upper band") coincide with RSI reaching the overbought zone ("Overbought"). Confirmation from two independent indicators makes the mean reversion signal more reliable than either the band touch or the RSI reading in isolation.
VWAP + Volume Profile: Volume profile shows price levels with high historical volume (high-volume nodes) versus low historical volume (low-volume nodes). Combining VWAP with volume profile reveals when the current intraday VWAP aligns with longer-term volume nodes — alignment increases the strength of the support/resistance reading.
VWAP + Moving Averages: A 9-EMA on a 5-minute chart can serve as a faster reference alongside VWAP. When the 9-EMA crosses VWAP on volume, it often precedes a session regime change (from above-VWAP buyer control to below-VWAP seller control or vice versa).
VWAP + market structure: For traders using Smart Money Concept approaches, VWAP often aligns with key institutional levels. Anchored VWAPs from major swing highs and lows frequently coincide with order block boundaries and liquidity zones identified through SMC analysis. The two analytical frameworks produce overlapping signals at major decision points.
VWAP + Fair Value Gaps: Imbalances identified through Fair Value Gap analysis often occur at or near VWAP, especially when major moves create rapid price displacement away from the volume-weighted average. The combination identifies high-probability mean reversion zones.
VWAP in Cryptocurrency Markets
Crypto markets present unique conditions that affect how VWAP should be applied. The 24/7 trading schedule eliminates the session reset that defines standard VWAP. Volume patterns shift across geographic sessions — Asian, European, and US trading hours each contribute different volume characteristics, and the transitions between sessions create periods of natural volume increase even without specific catalysts.
For Bitcoin and Ethereum trading, anchored VWAP is the standard approach. Common anchor points include:
- Major news events: ETF approvals, exchange collapses, regulatory announcements, Federal Reserve decisions affecting risk assets broadly
- Range breakouts: anchored to the candle that breaks a multi-week consolidation
- Trend origins: anchored to the swing low (for uptrends) or swing high (for downtrends) where a major move began
- Halving events: anchored to the Bitcoin halving date, providing a long-term cost basis reference
Multiple anchored VWAPs can run simultaneously — one anchored to a recent earnings or news event for short-term reference, one anchored to a major trend origin for medium-term context, one anchored to a long-term cycle event (like a halving) for macro perspective. Where multiple anchored VWAPs converge, they often mark significant price levels.
The Pyth Network oracle data used by Upscale's TradingView terminal provides the volume-weighted price feeds necessary for accurate VWAP calculation across the supported crypto assets. Traders running scalping or short-term strategies on the platform can apply the standard VWAP and anchored VWAP indicators directly through the integrated TradingView interface.
While none of the funded traders profiled in our success cases compilation use VWAP as their primary tool — most rely on Smart Money Concept, indicator stacks like RSI/MACD/Fibonacci, or pure price action — many use the same multi-timeframe analytical methodology that VWAP supports. Joshua's daily/4H/intraday/15M workflow, Exerato's daily Dealing Range to 15M entry sequence, and Albert's structured top-down approach all reflect the same principle that anchored VWAP makes explicit: align short-term decisions with longer-timeframe context.
Building a VWAP-Based Approach
For traders integrating VWAP into an existing system, a practical sequence:
- Add VWAP to your primary chart timeframe. For day traders, that's typically 5-minute or 15-minute charts. Observe how price interacts with the line over multiple sessions before trading off it.
- Identify the session character. Trending sessions (price holds one side of VWAP throughout) call for trend-continuation setups. Range sessions (price oscillates around VWAP) call for mean-reversion setups. Misreading session character is the most common source of VWAP losses.
- Add anchored VWAPs at significant events. For each instrument traded, identify two or three anchor points (recent earnings, major news, trend origin) and keep those anchored VWAPs persistent on the chart.
- Confirm signals with volume. A VWAP bounce or break on declining volume is more likely to fail than one with volume expansion. Volume confirmation should be a non-negotiable filter.
- Define exits independently. VWAP signals entries well, but VWAP returning to neutral isn't a clean exit signal. Use technical levels (prior swing highs/lows, structural levels) or trailing stops for exits, as covered in our trailing stop loss orders guide.
The traders who get consistent results from VWAP treat it as one component of a structured approach, not as a standalone signal generator. The indicator's strength is in providing a fair-value reference that aligns with how institutional execution actually occurs; the trader's job is to combine that reference with directional bias from other tools and risk management discipline that survives the inevitable false signals.
Key Takeaways
VWAP is a measurement tool, not a strategy. The line itself is a calculated reference — Σ(Typical Price × Volume) ÷ Σ(Volume) accumulated from a starting point — that quantifies where actual trading activity occurred during a session or from an anchor event. The strategies built around VWAP succeed or fail based on how the indicator is combined with market context, volume confirmation, and complementary tools. Treating any VWAP cross as a trade signal in isolation produces too many false positives to be profitable; treating VWAP as a fair-value reference and a filter for other signals produces consistent edge over time.
The standard VWAP and anchored VWAP serve different purposes and should not be confused. Standard VWAP is intraday only, useful for day trading and execution analysis on instruments with clear session boundaries. Anchored VWAP works across any timeframe by allowing the trader to define what event the average should be measured from — making it the only viable variant for crypto markets and the more powerful variant for analyzing specific event reactions in any market. Both have been part of professional execution and trading since Berkowitz, Logue, and Noser (1988) introduced VWAP as the institutional execution benchmark, and Brian Shannon popularized the anchored variant for retail discretionary trading.
The disciplined approach to VWAP requires understanding when to use it and when not to. It works during active sessions with sufficient volume — most US equity day trading hours, major crypto news periods, and active forex sessions for major pairs. It loses meaning during low-volume periods, in markets with poor volume data, and outside the timeframes for which it was designed. Combined with other indicators and a clear understanding of the session character, VWAP earns its place in the toolkit of intraday and short-term traders. Used as a standalone reversal signal or pulled into multi-week analysis where it doesn't apply, it produces inconsistent results that frustrate traders who haven't internalized its limitations.
Start now: 👉 Upscale.trade | Telegram Bot
Follow us: 📺 YouTube | 𝕏 Twitter
Frequently Asked Questions
What is the VWAP indicator and how does it work?
VWAP (Volume-Weighted Average Price) is the average price at which an asset has traded during a period, weighted by trading volume. The formula is Σ(Typical Price × Volume) ÷ Σ(Volume), where Typical Price for each candle equals (High + Low + Close) ÷ 3. The indicator accumulates from a starting point (session open for standard VWAP, manually selected anchor for anchored VWAP) and provides a reference price that reflects where actual trading activity occurred. VWAP was introduced by Berkowitz, Logue, and Noser (1988) in the Journal of Finance as an institutional execution benchmark and remains the standard measure of trade execution quality for large institutional orders.
How is VWAP calculated?
For each candle: multiply Typical Price (High + Low + Close ÷ 3) by Volume to get the period's contribution to the numerator. Sum these products from the start of the session (or anchor point) through the current candle. Separately, sum the volumes from the same starting point. Divide the cumulative product sum by the cumulative volume sum. The result is the current VWAP, which extends with each new candle. Modern charting platforms calculate VWAP automatically — the manual calculation matters only for understanding why the indicator behaves the way it does (slow to react late in session because cumulative volume becomes large, more sensitive early when volume is small).
How can traders use VWAP for entry and exit strategies?
Three primary approaches. First, dynamic support/resistance: in trending sessions, price tends to bounce off VWAP during pullbacks (uptrend) or reject from it on rallies (downtrend), providing entries with stops just past the line. Second, breakout trades: when price has held one side of VWAP throughout the session and then crosses on increasing volume, the cross can signal regime change. Third, mean reversion at VWAP standard deviation bands: when price extends to ±2 standard deviation bands, statistical mean reversion to VWAP becomes more likely. Exits should be defined by technical levels or trailing stops rather than VWAP returning to neutral, because the indicator's "normalization" doesn't constitute a clean exit signal.
What are the limitations of the VWAP indicator?
Standard VWAP resets daily, making it intraday-only — multi-day analysis with the standard variant produces disconnected daily lines rather than a continuous reference. Low-volume sessions reduce VWAP reliability because each tick carries disproportionate weight on the line. Crypto markets have no natural session boundaries, requiring anchored VWAP rather than the standard variant. VWAP signals on their own produce too many false positives — most price crosses through VWAP during a typical session are noise, not signals. The indicator works best as a filter combined with volume confirmation and other technical tools, not as a standalone signal generator.
How does VWAP differ from a Simple Moving Average?
Simple Moving Average averages the last N closes equally, regardless of when they occurred or how much volume traded at those prices. VWAP weights by volume — periods with more trading activity contribute more to the line. SMA has no anchor and rolls continuously. VWAP is anchored to a starting point (session open or manual anchor) and accumulates from there. SMA is suitable for trend identification across days/weeks; VWAP is suitable for intraday fair-value reference and execution benchmarking. Most professional traders use both because they answer different questions: SMA shows recent trend direction, VWAP shows where actual trading occurred today.
What's the difference between VWAP and TWAP?
VWAP weights by volume; TWAP weights by time. TWAP averages the typical price over equal time intervals regardless of how much volume occurred in each interval — Σ(Typical Price) ÷ N, where N is the number of periods. TWAP exists primarily for execution algorithms that want to spread orders evenly across time without responding to volume. For analytical purposes, VWAP is almost always more useful because it captures where actual trading activity occurred. TWAP is useful as a fallback in markets where volume data is unreliable, but for charts on liquid instruments, VWAP is the better reference.
What is anchored VWAP and when should I use it?
Anchored VWAP allows manually setting the starting point of the calculation. Once anchored, VWAP accumulates identically from that point forward — Σ(TP × Volume) ÷ Σ(Volume) from the anchor. The technique was popularized by trader and educator Brian Shannon and addresses standard VWAP's limitation of resetting at arbitrary session boundaries. Use anchored VWAP for: earnings reactions (anchor to the close before earnings), Fed announcements (anchor to the close before the announcement), trend origins (anchor to the swing low/high where a major move began), range breakouts (anchor to the breakout candle), and crypto markets generally (where 24/7 trading makes standard VWAP impractical). Multiple anchored VWAPs can run simultaneously, with their convergences often marking significant price levels.
Why is VWAP so important to institutional traders?
VWAP is the industry-standard benchmark for trade execution quality. When a fund manager places a large order, the broker's execution is evaluated against VWAP for the order period — buying below VWAP indicates skilled execution, buying above indicates poor execution. This benchmark exists because for orders large enough to move prices, the volume-weighted average reflects what would have been achievable by a passive trader matching the natural market flow. Berkowitz, Logue, and Noser (1988) formalized this framework in the Journal of Finance, and it has been the foundation of execution analytics ever since. Retail traders benefit from understanding institutional VWAP usage because price action around VWAP often reflects institutional execution patterns — large orders being worked toward VWAP tend to defend the line, providing the support/resistance behavior that makes VWAP useful as an analytical tool.


